

At the open
Screening
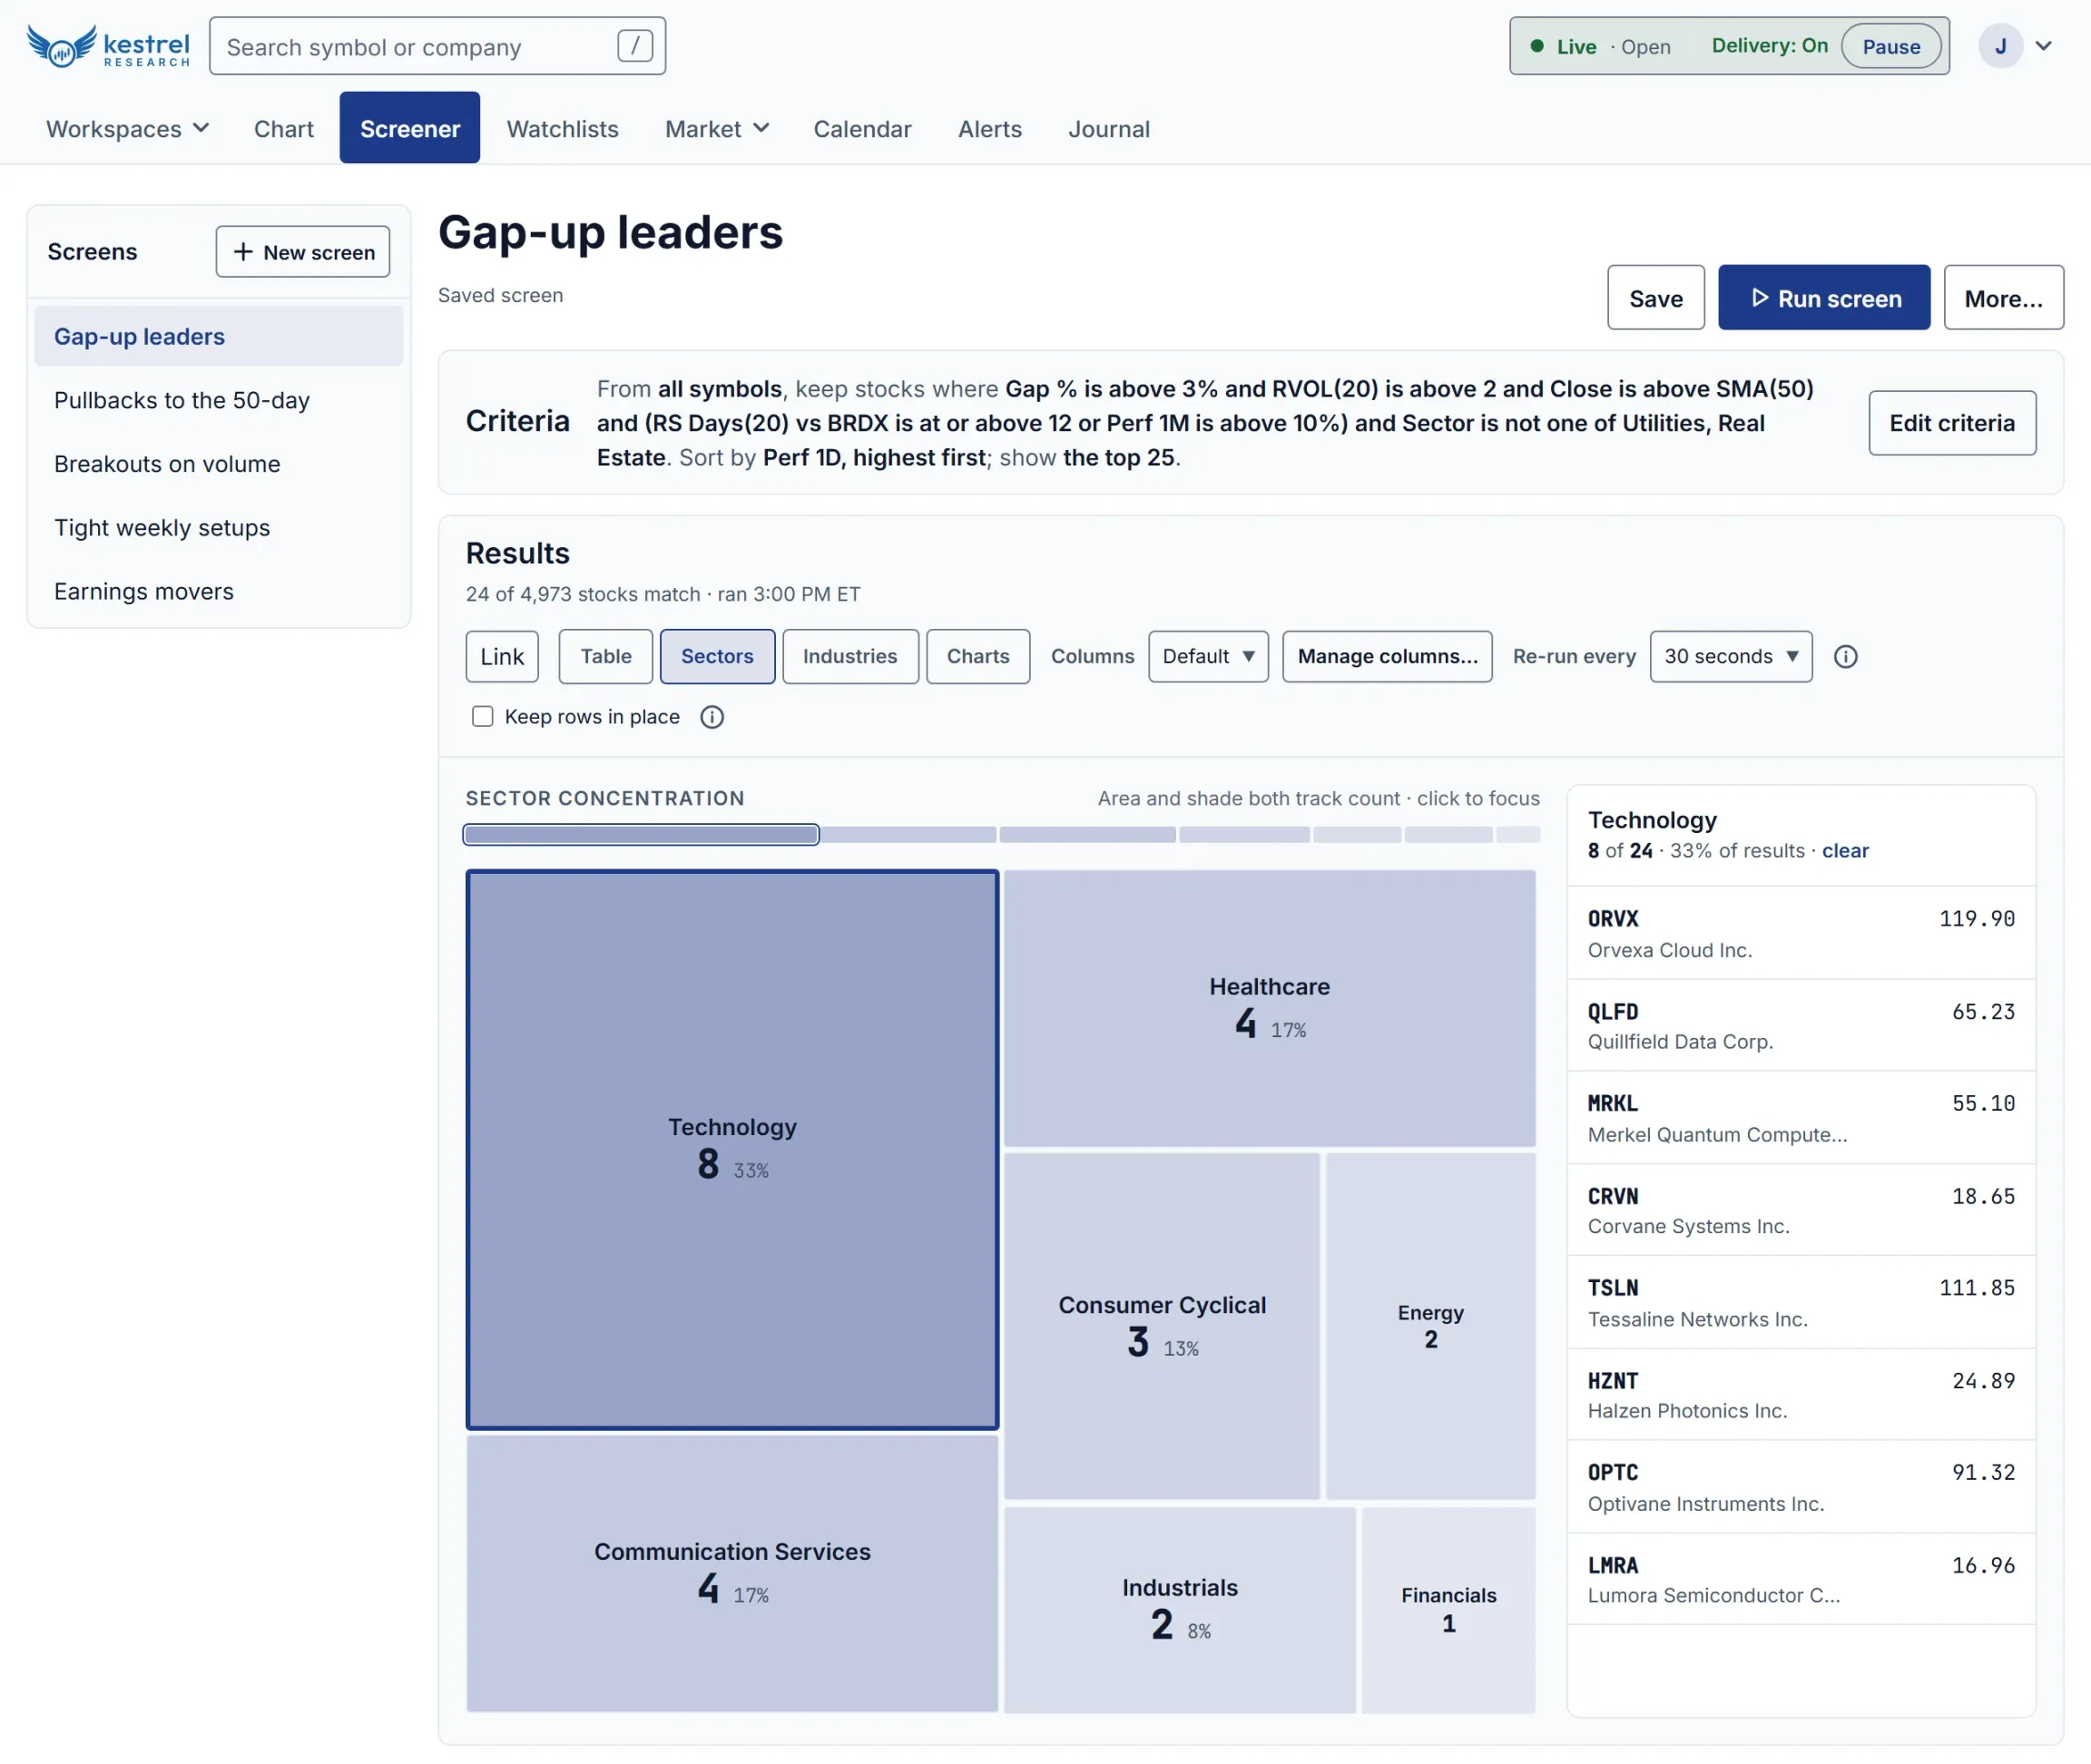
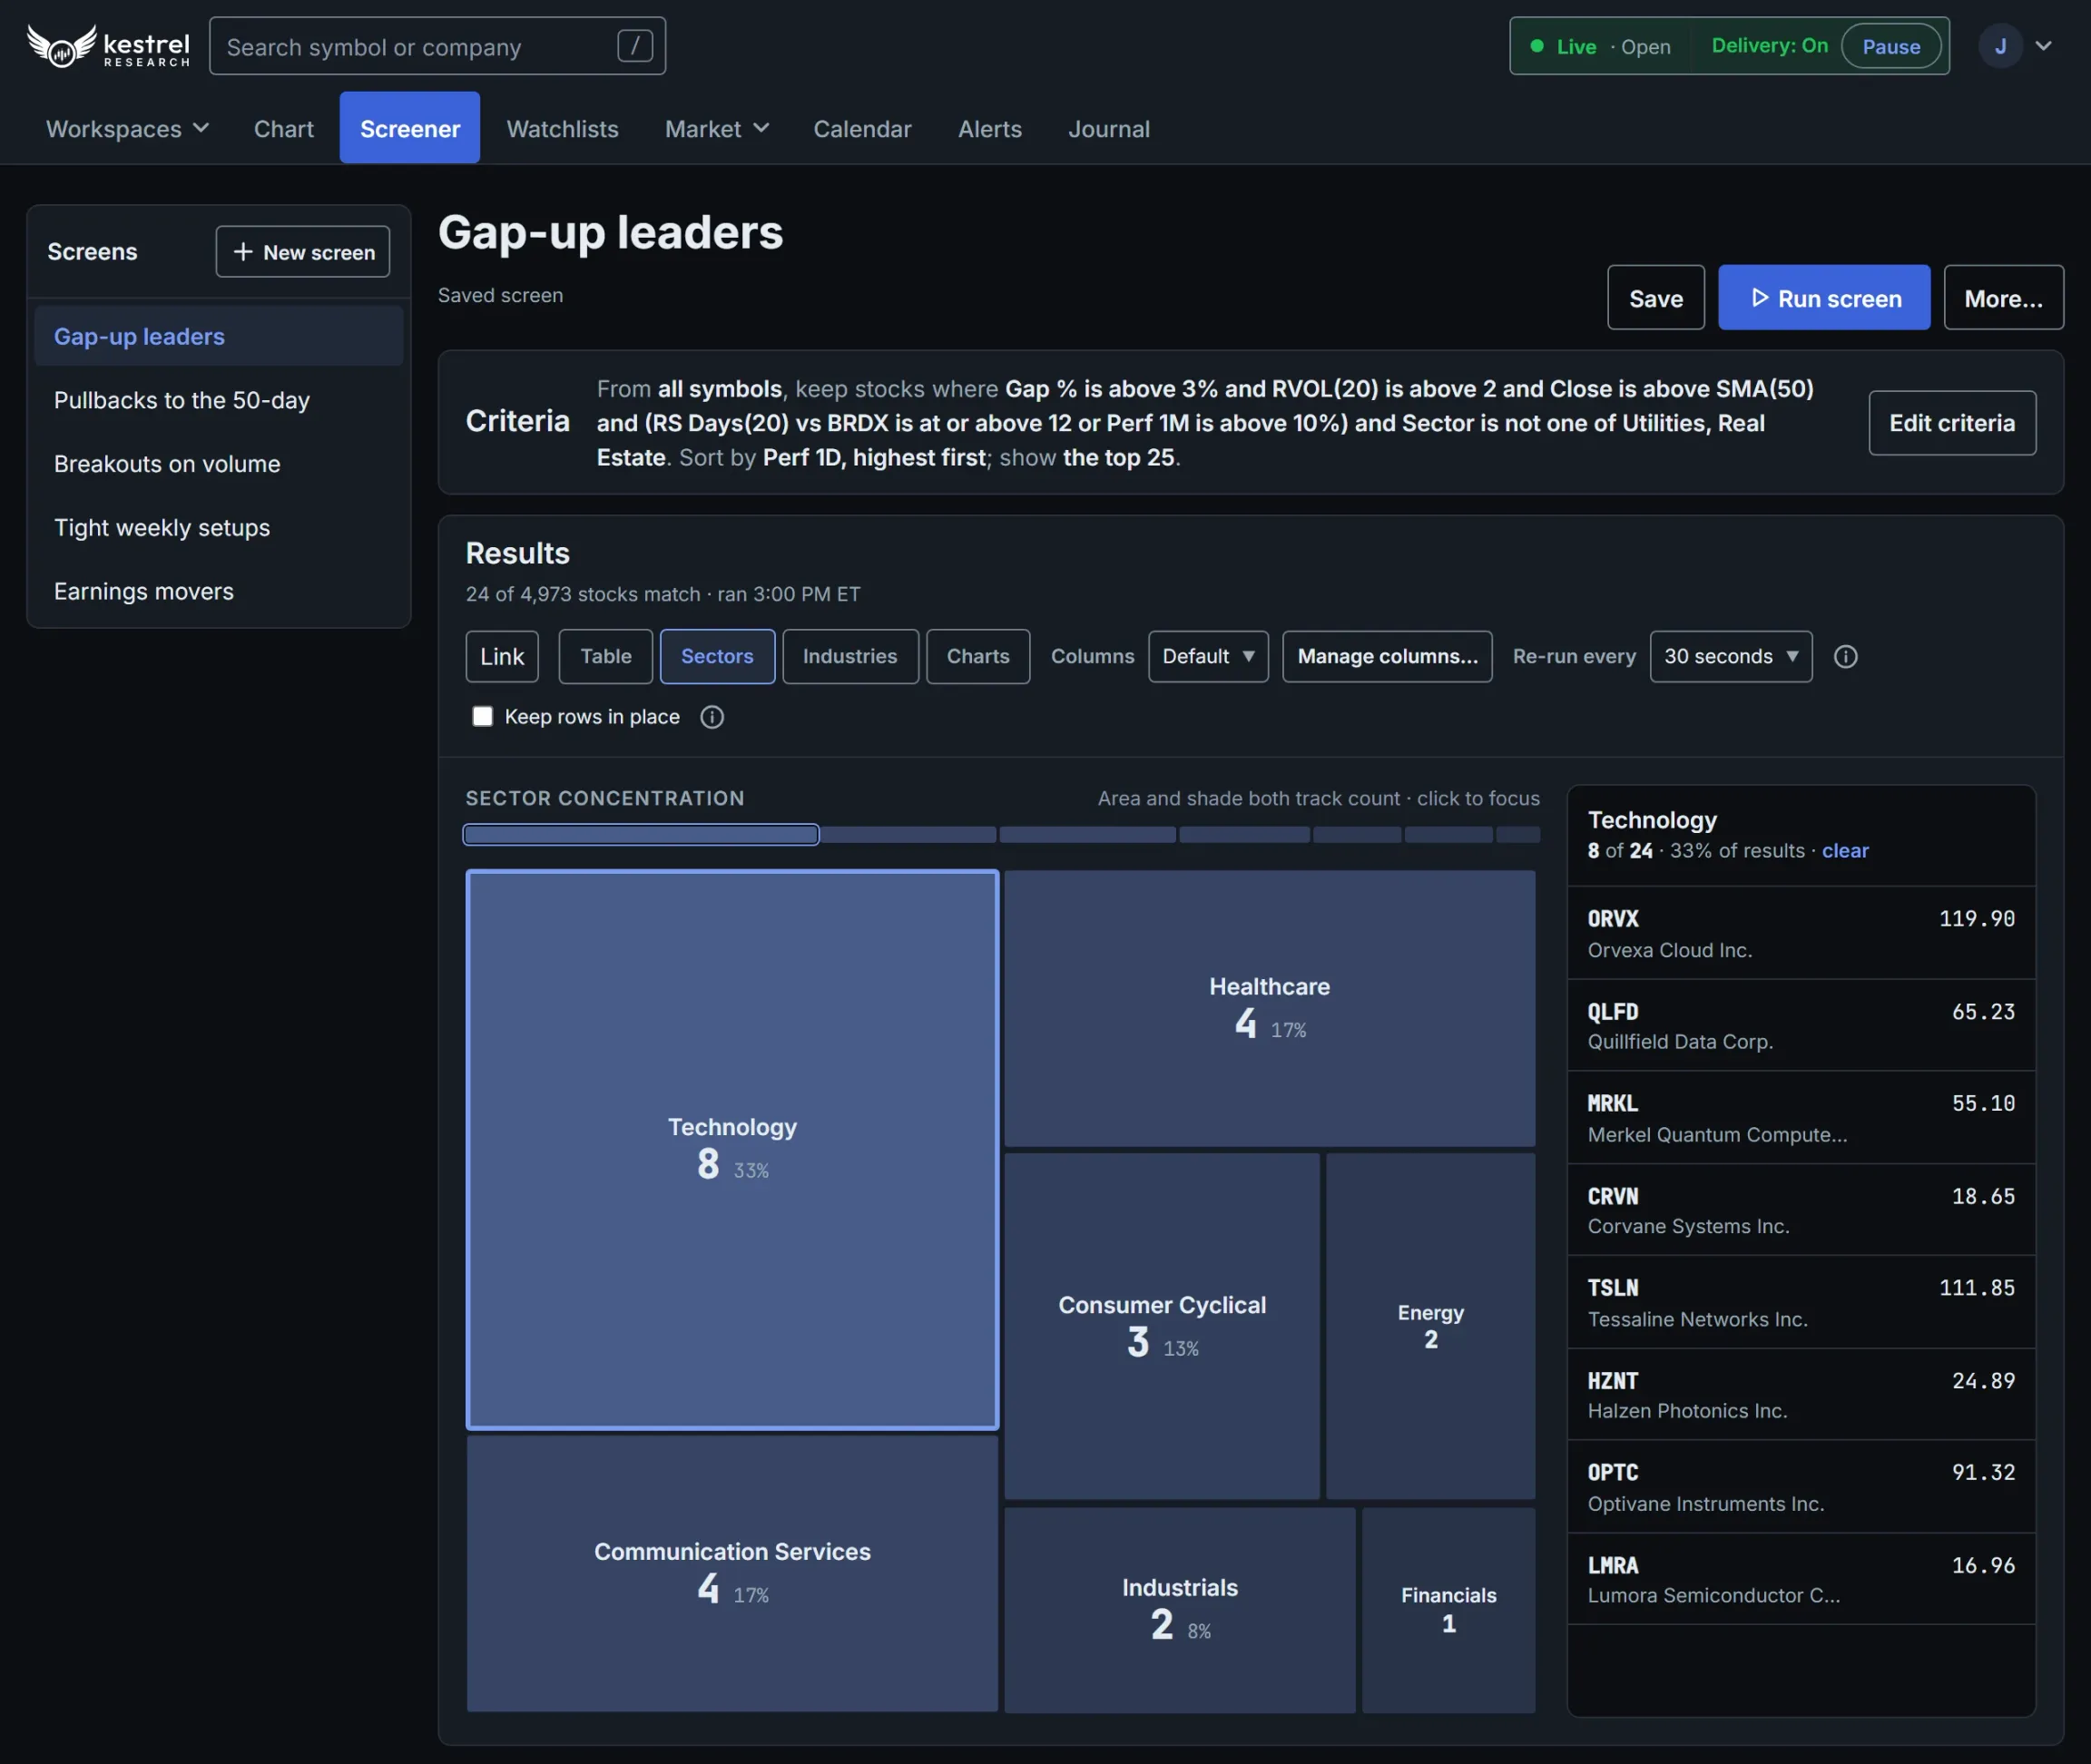
Build screens from over 200 data points, from price and volume to indicators and fundamentals, and watch the results through the session.
Building a screen
- Pick each condition from a searchable list, and compare a value with a number or with another measure, such as the close against its 50-day average.
- Nest groups of conditions, each with its own all or any.
- Read the whole screen back as one plain sentence.
- Start from the whole market, or from any mix of your saved screens, watchlists and themes.
What you can screen on
- Price and volume, relative volume and dollar volume.
- Moving averages, momentum, volatility, bands and channels, and relative strength against a benchmark, on daily or weekly bars.
- Session figures such as the gap, VWAP and the opening range; 52-week highs and lows; performance from one day to year to date.
- Over 140 fundamentals, from valuation and growth to profitability and financial strength.
- Sector, industry, theme and security type, priming patterns, and stage analysis on weekly bars.
- Conditions such as is above, below or between, crosses above or below (within the last few bars if you like), and rising or falling over a number of bars.
Watching it live
- Figures update live, and the screen re-runs every 5 to 60 seconds to add and drop stocks.
- Keep rows in place while their values keep updating.
- See how many stocks match, and how many are shown.
Reading the results
- Sort by any measure, and keep the top results by count or by percentage.
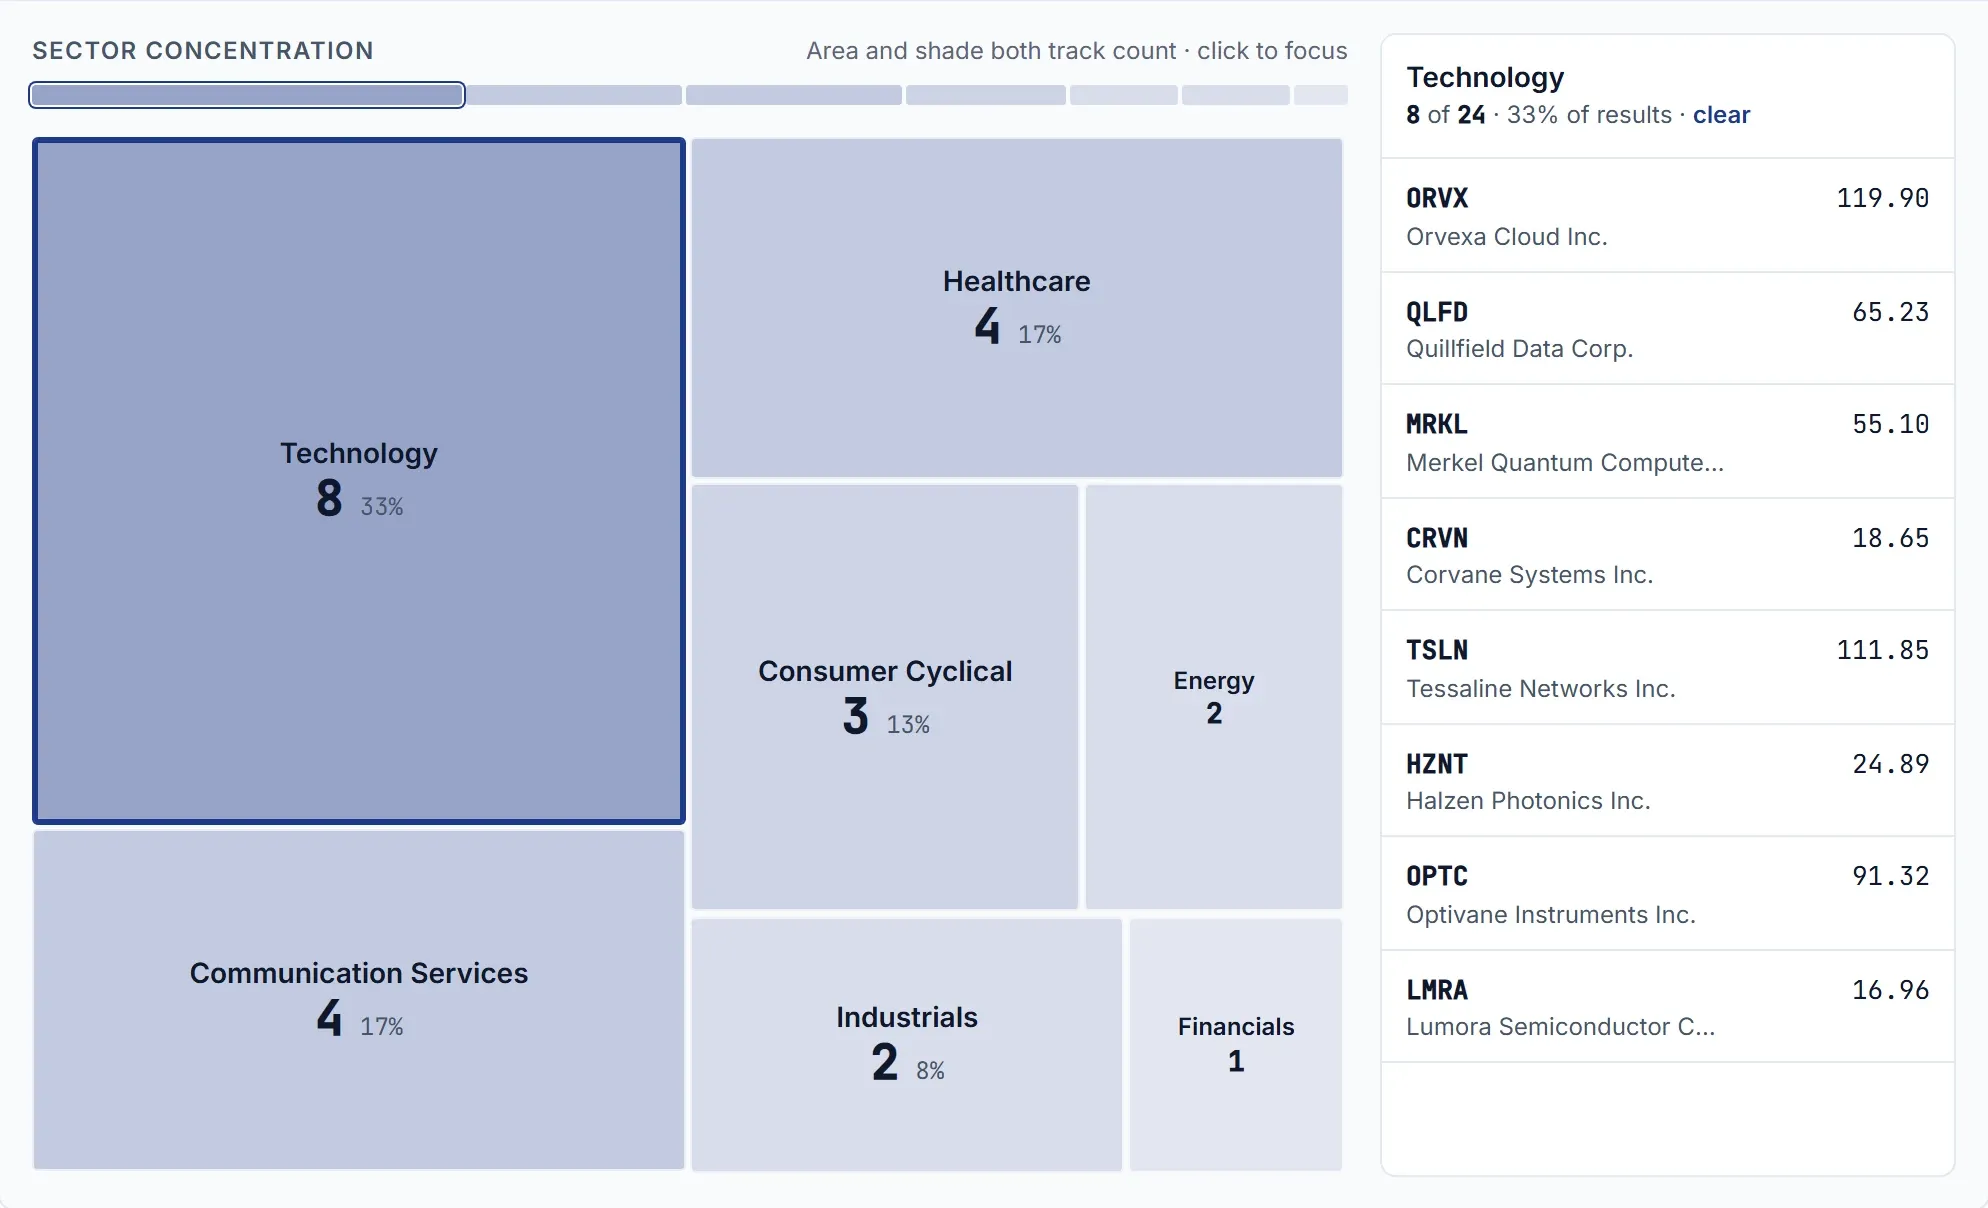
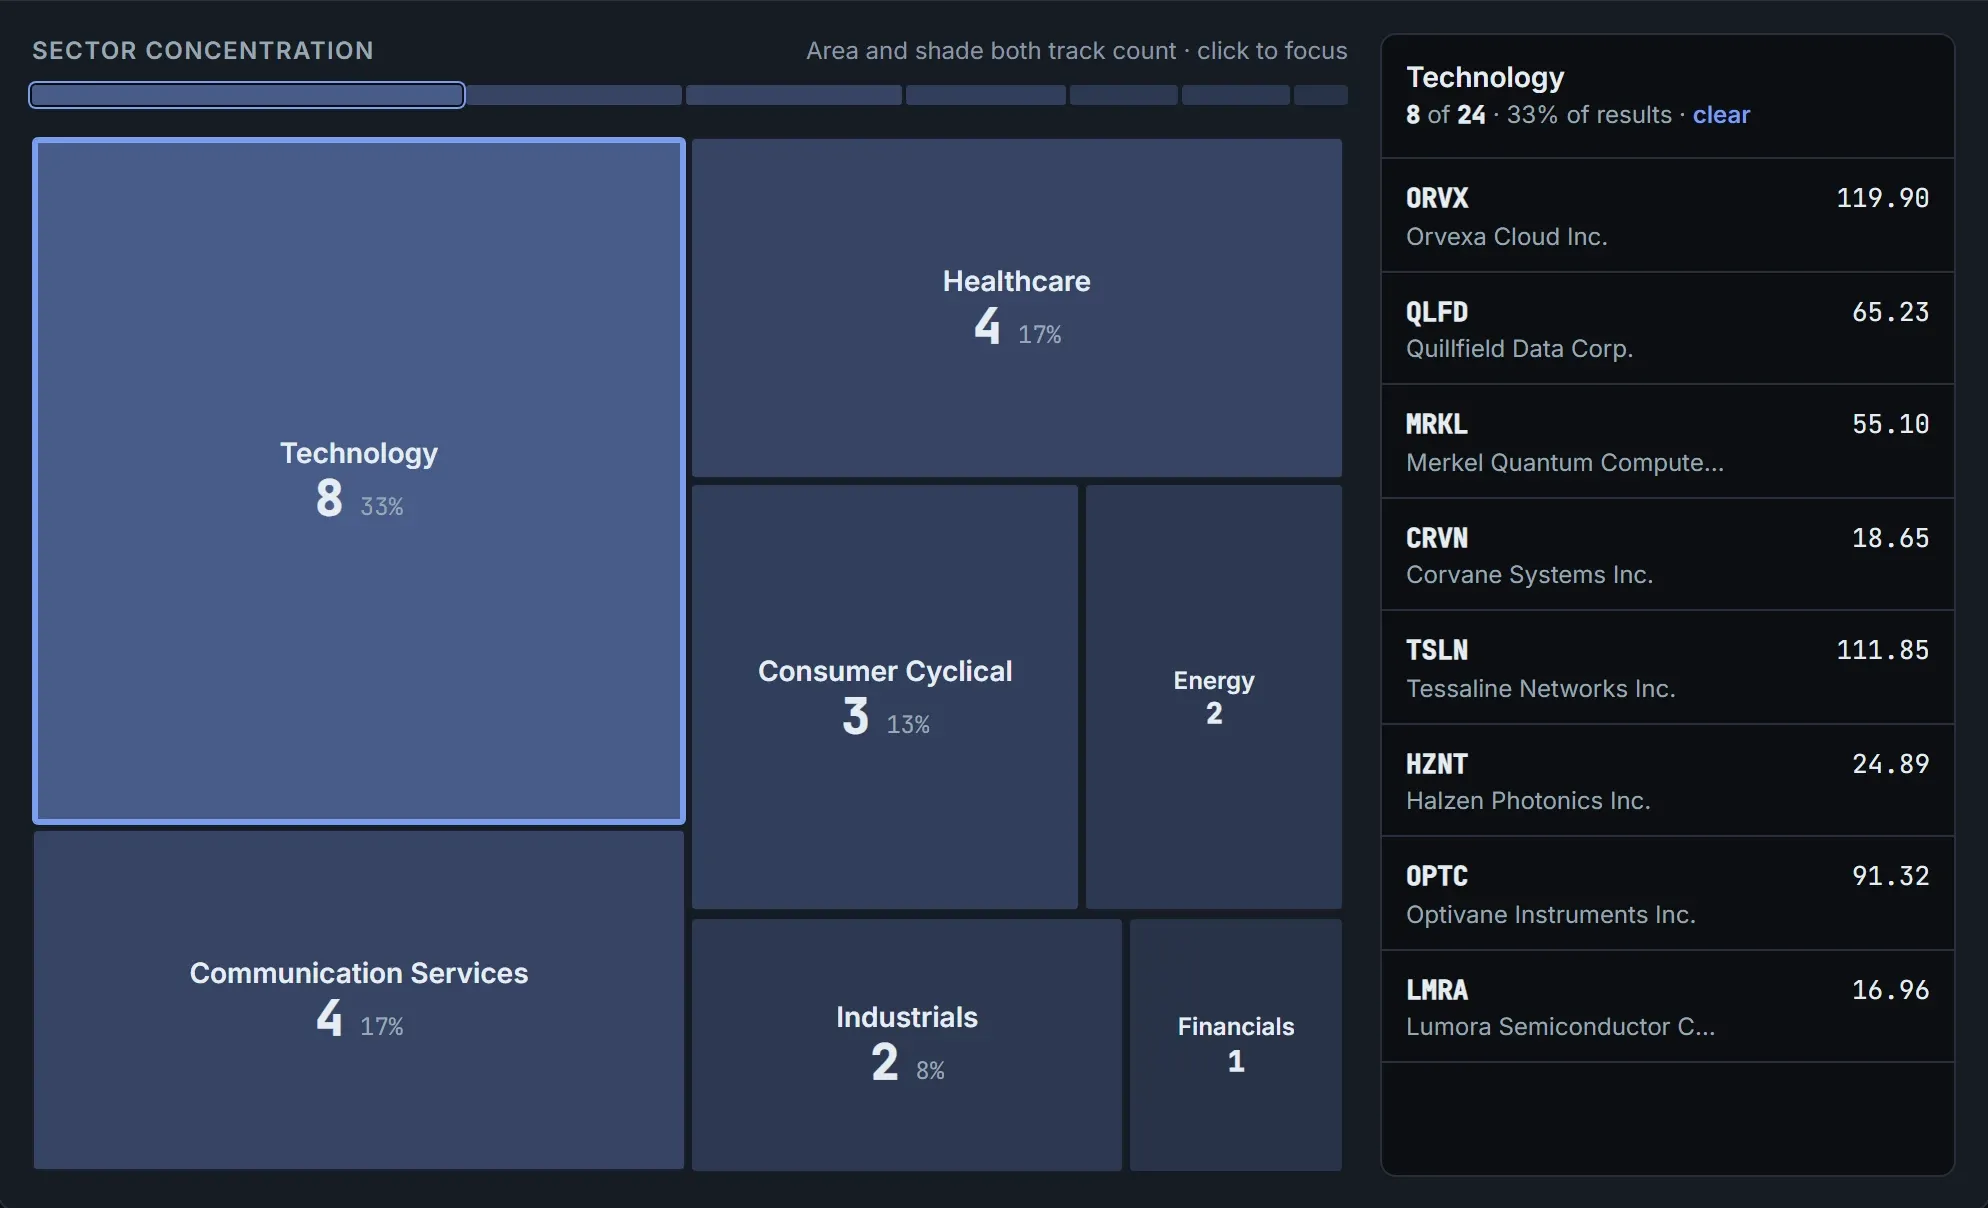
- Read them as a table, as sector and industry heat maps, or as chart cards.
- Open a quick-look chart for any result, with its bid and ask and the session's figures, and step through results with the arrow keys.
- Add a stock to a watchlist from its row, or send it to a linked chart.
Keeping your work
- Save, rename and copy your screens.
- Build column sets with your own labels, formats and order.
Screenshots are of the product itself, with made-up companies and prices.