

Before the open
Market context
Breadth, sector, industry and theme rotation, the short side and the calendar, so you know what kind of day it is before you pick a name.
Breadth
- A breadth chart in six panes: direction, volume, stocks above their 20-, 50- and 200-day averages, momentum, new highs and lows, and thrust.
- Five cards that each read bullish, neutral or bearish, with one line that sums them up.
- Today's reading updates live; earlier sessions are final. Look back a month to a year, or read it as a table.
- A plain explanation of which stocks are counted and what each measure means.
Sectors, industries and themes
- Rankings by heat or by return over one week to six months, against the index you choose.
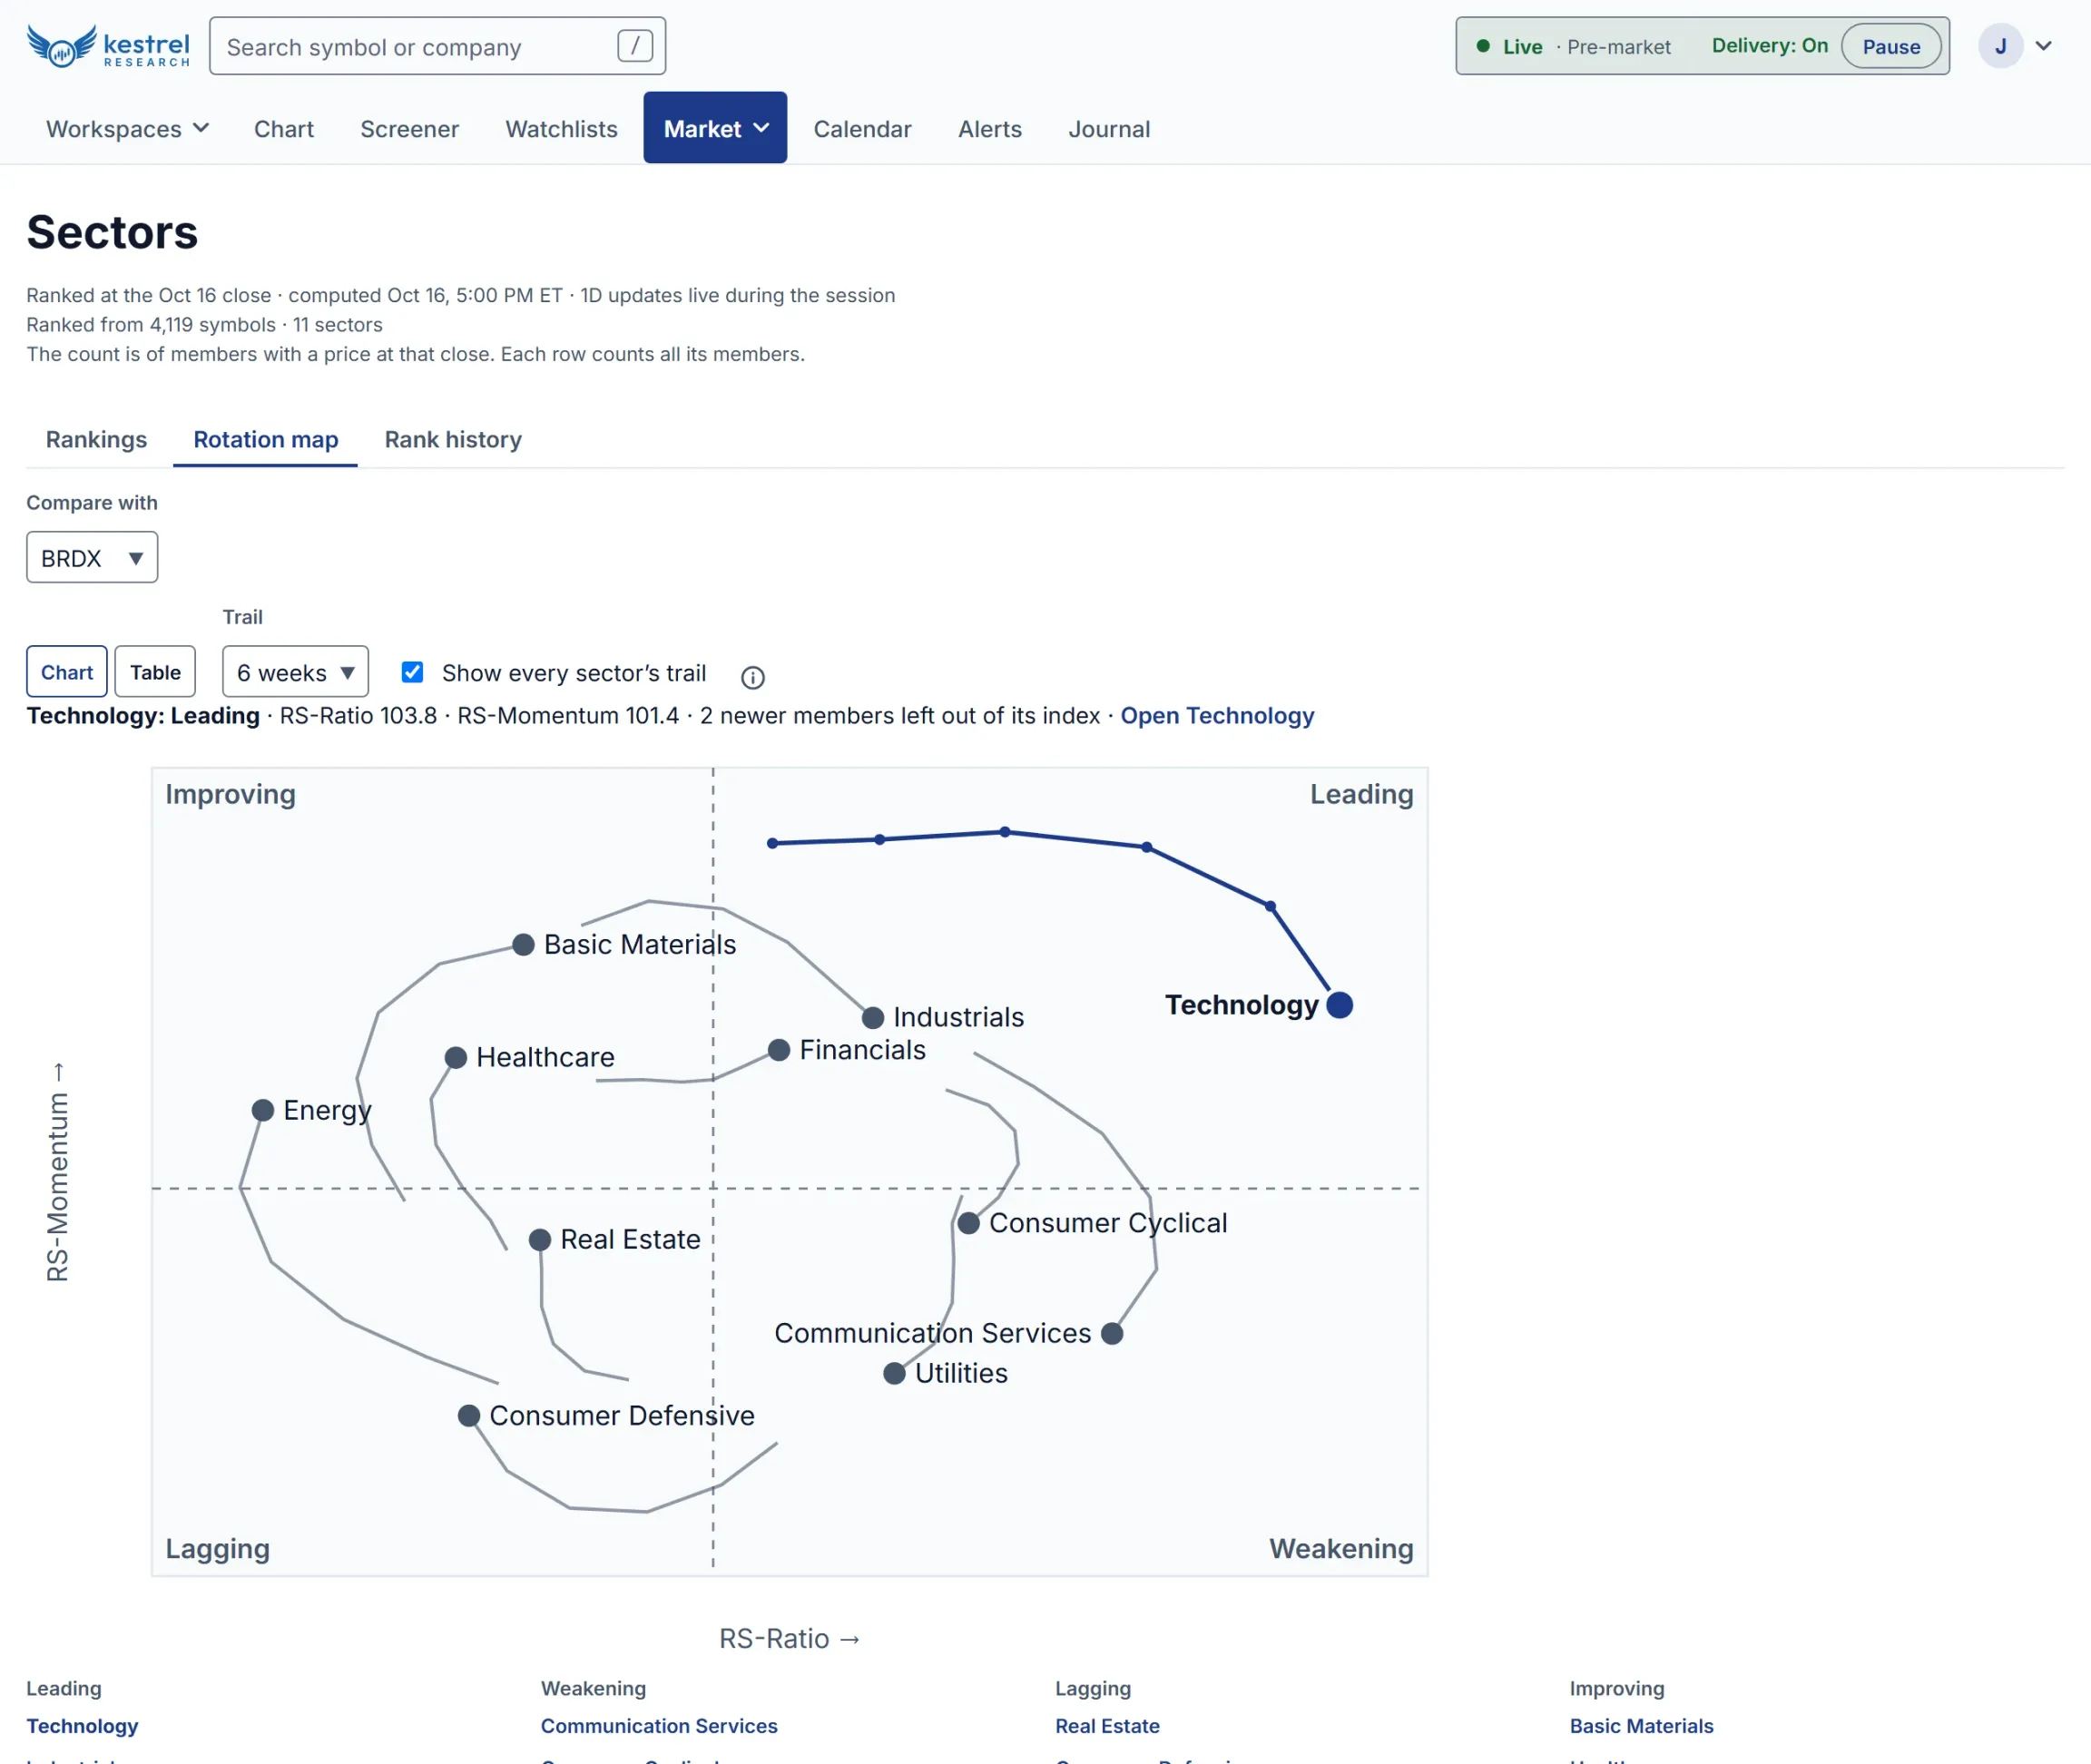
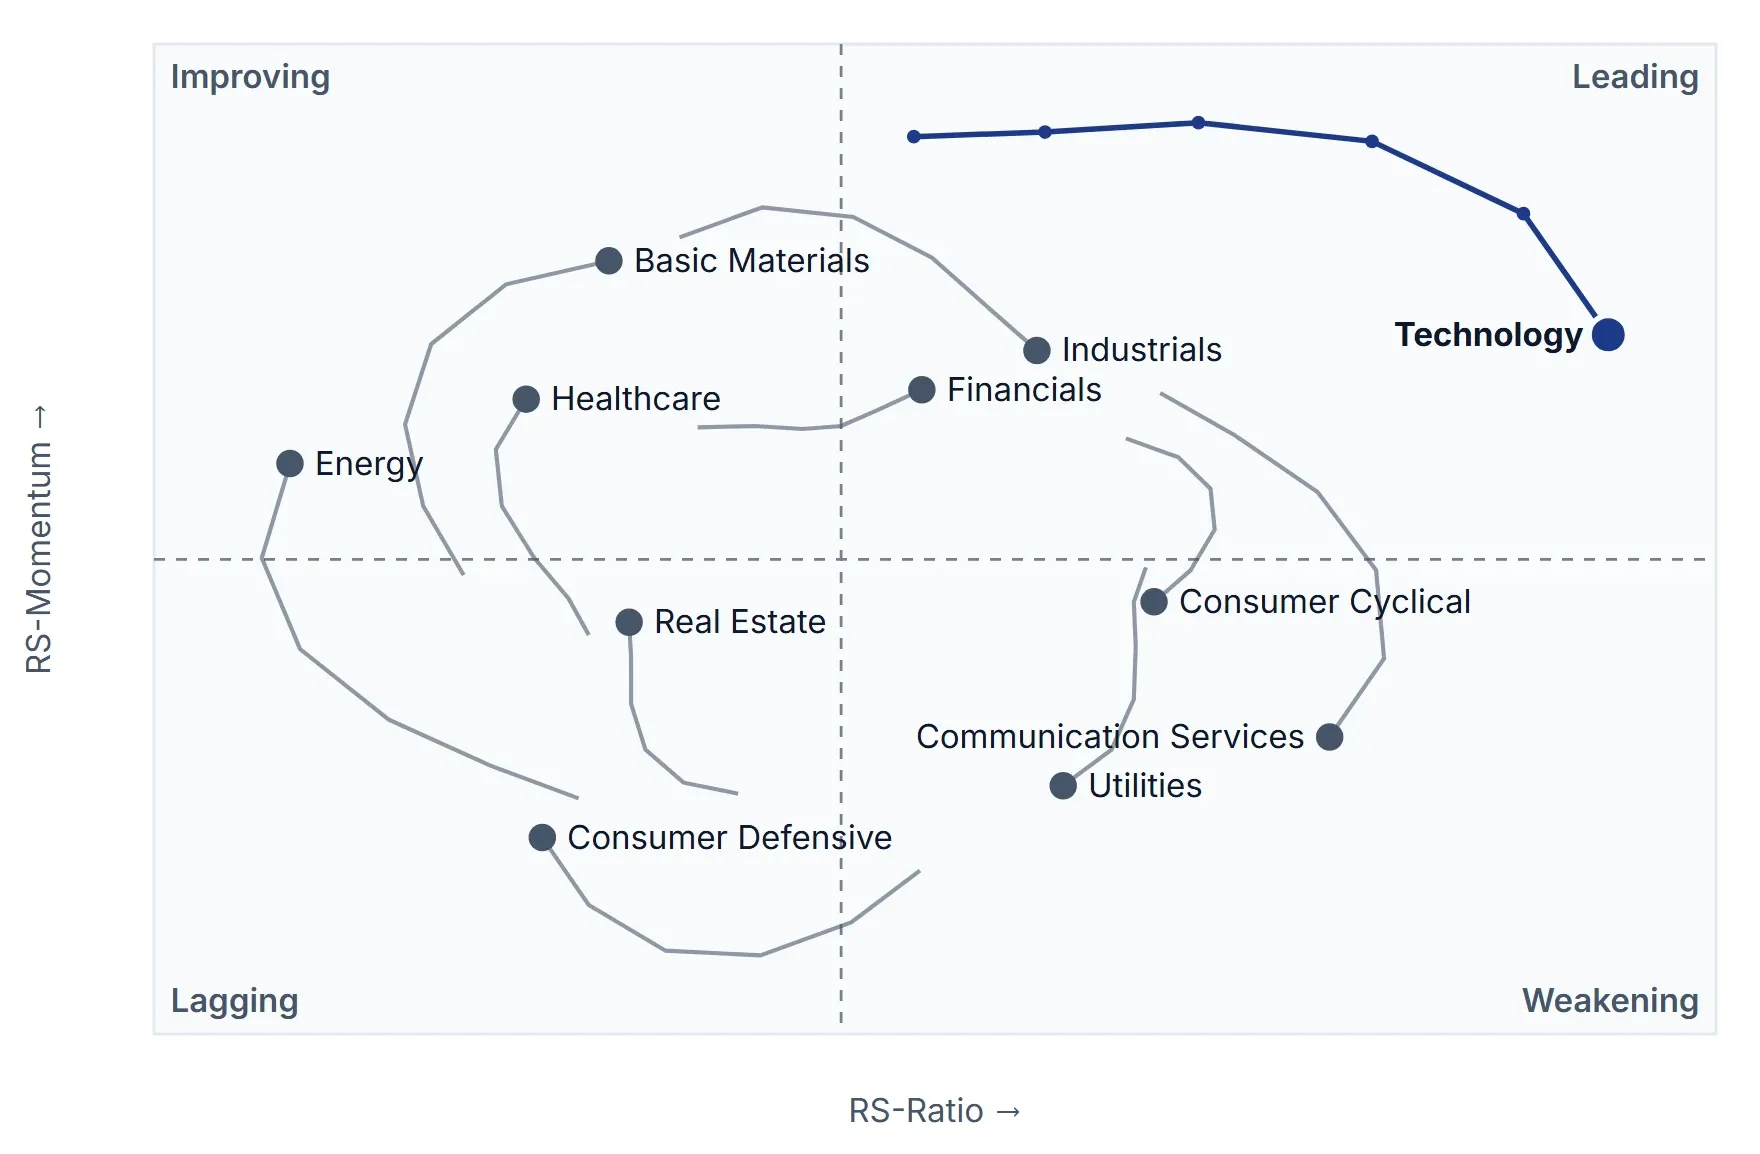
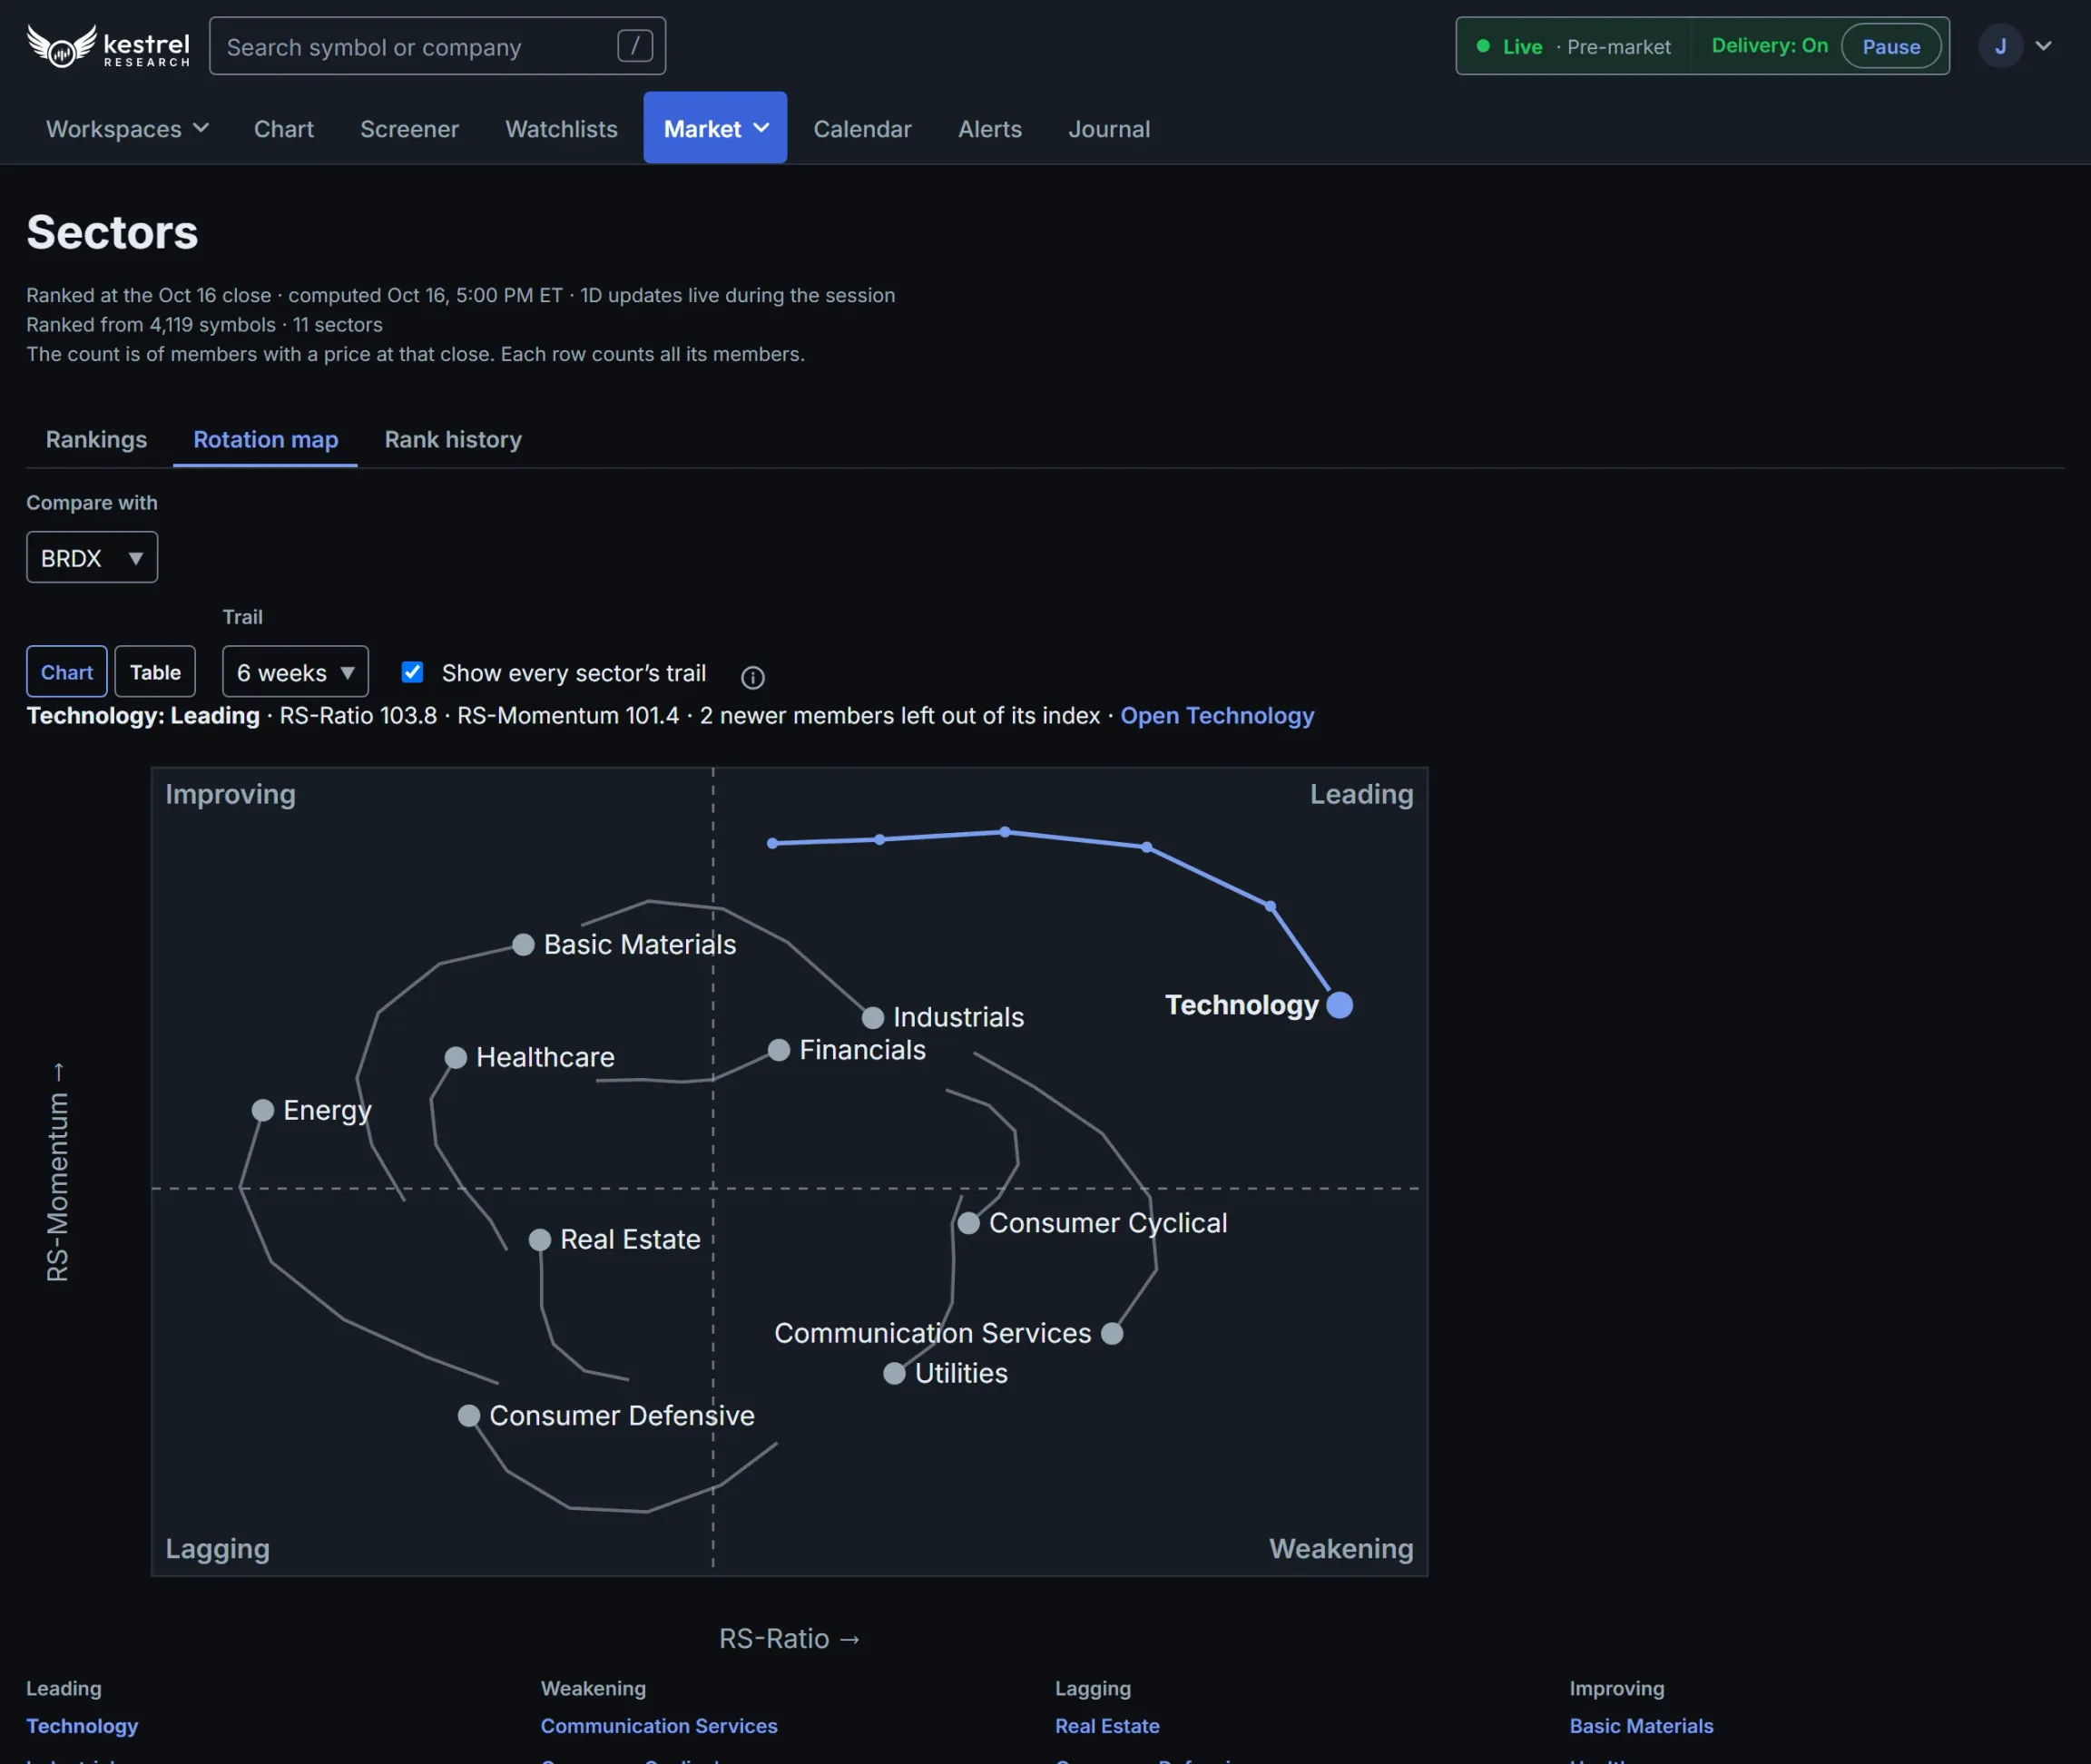
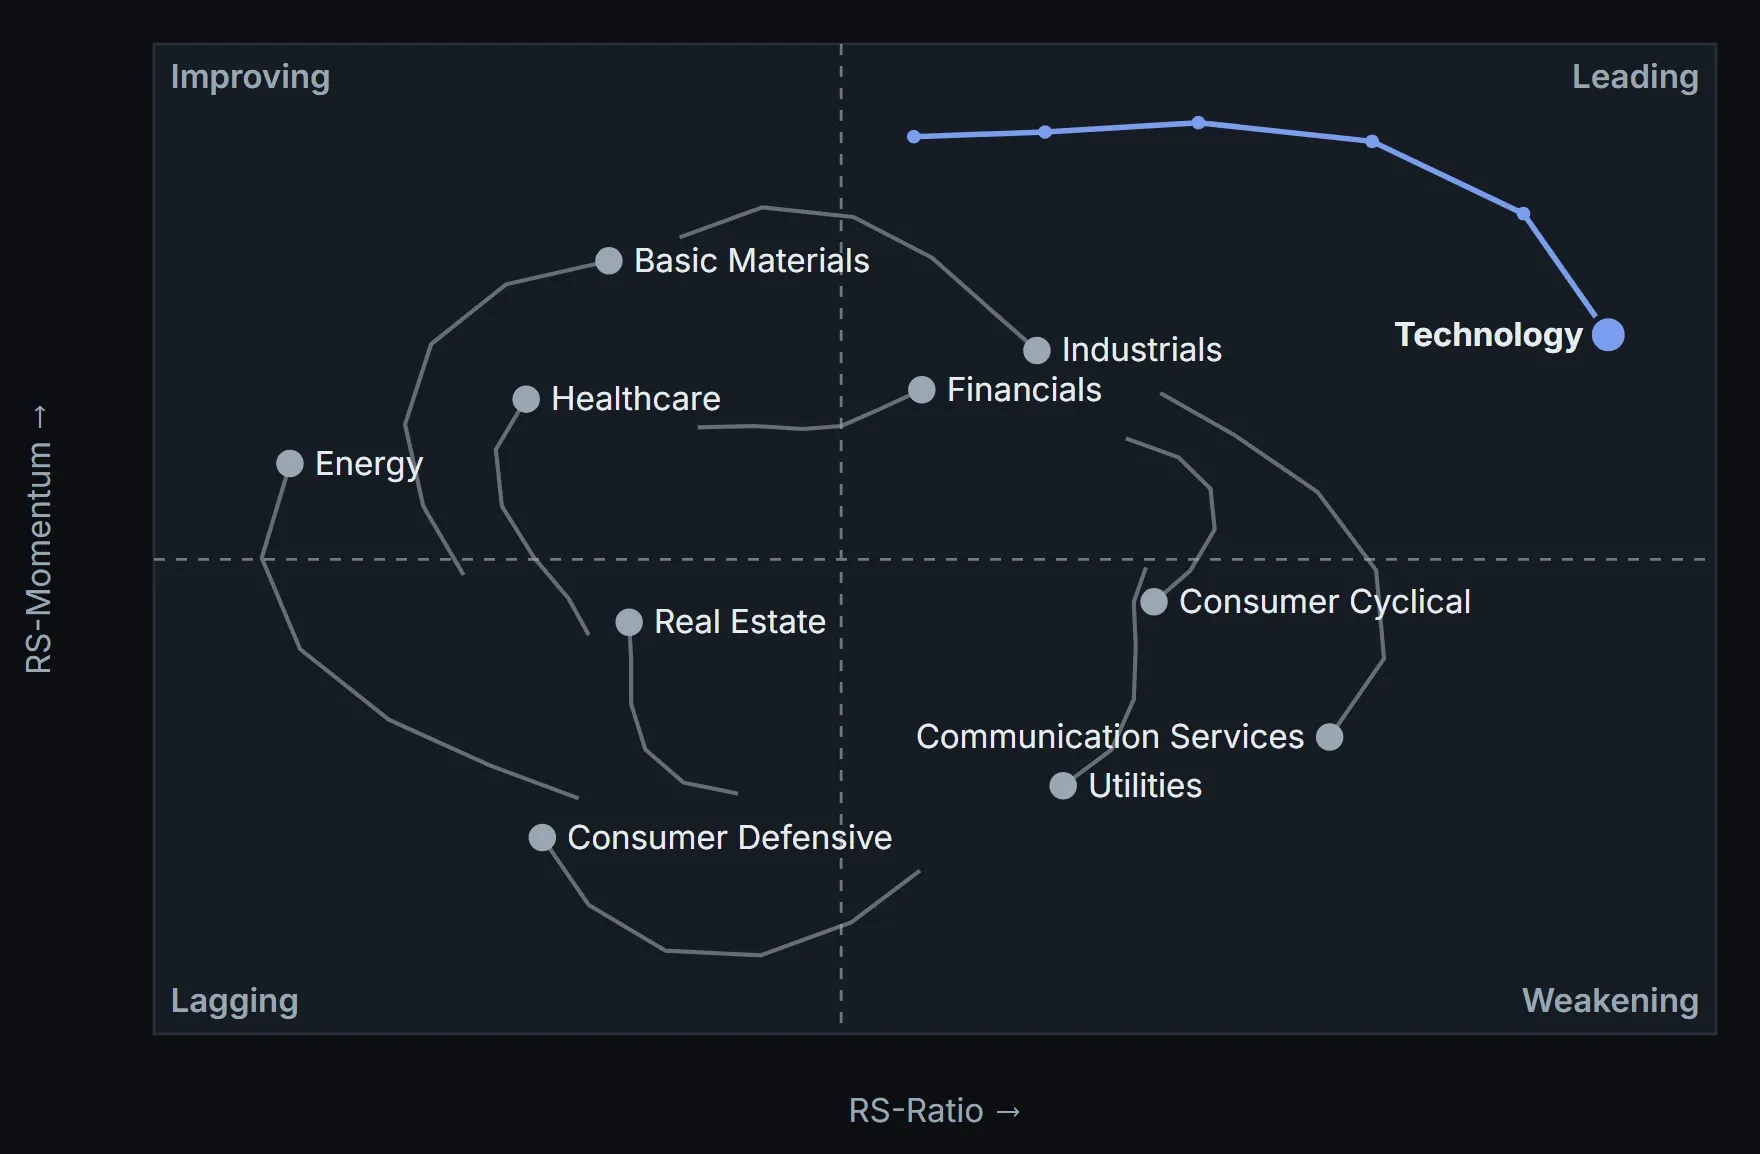
- A rotation map that places each group as leading, weakening, lagging or improving, with its trail over recent weeks.
- Each group's rank over the past quarter, half year or year.
- Groups heating up, cooling off, near their highs, or seeing volume surge.
- A page for every group: how it ranks, what makes it hot and how each member is doing. Screen a theme's members in one click.
The short side
- The Reg SHO threshold lists, with days on the list, names nearing close-out and names new today.
- A short-sale restriction list, worked out from the day's prices.
- The stocks most crowded by short sellers, and the ones funds added most last quarter, by sector.
- For any stock: short interest as shares, % of float and days to cover, its off-exchange short volume ratio, and an estimate of how hard it is to borrow.
The calendar
- Earnings, dividends and splits, and economic releases, by month or by week.
- Narrow it to a watchlist or a saved screen, and to the event types and times of day you care about.
- Earnings against estimates, and economic releases with the actual, estimate, previous and impact.
- Market holidays and early closes, marked.
Screenshots are of the product itself, with made-up companies and prices.