

Through the session
Charting
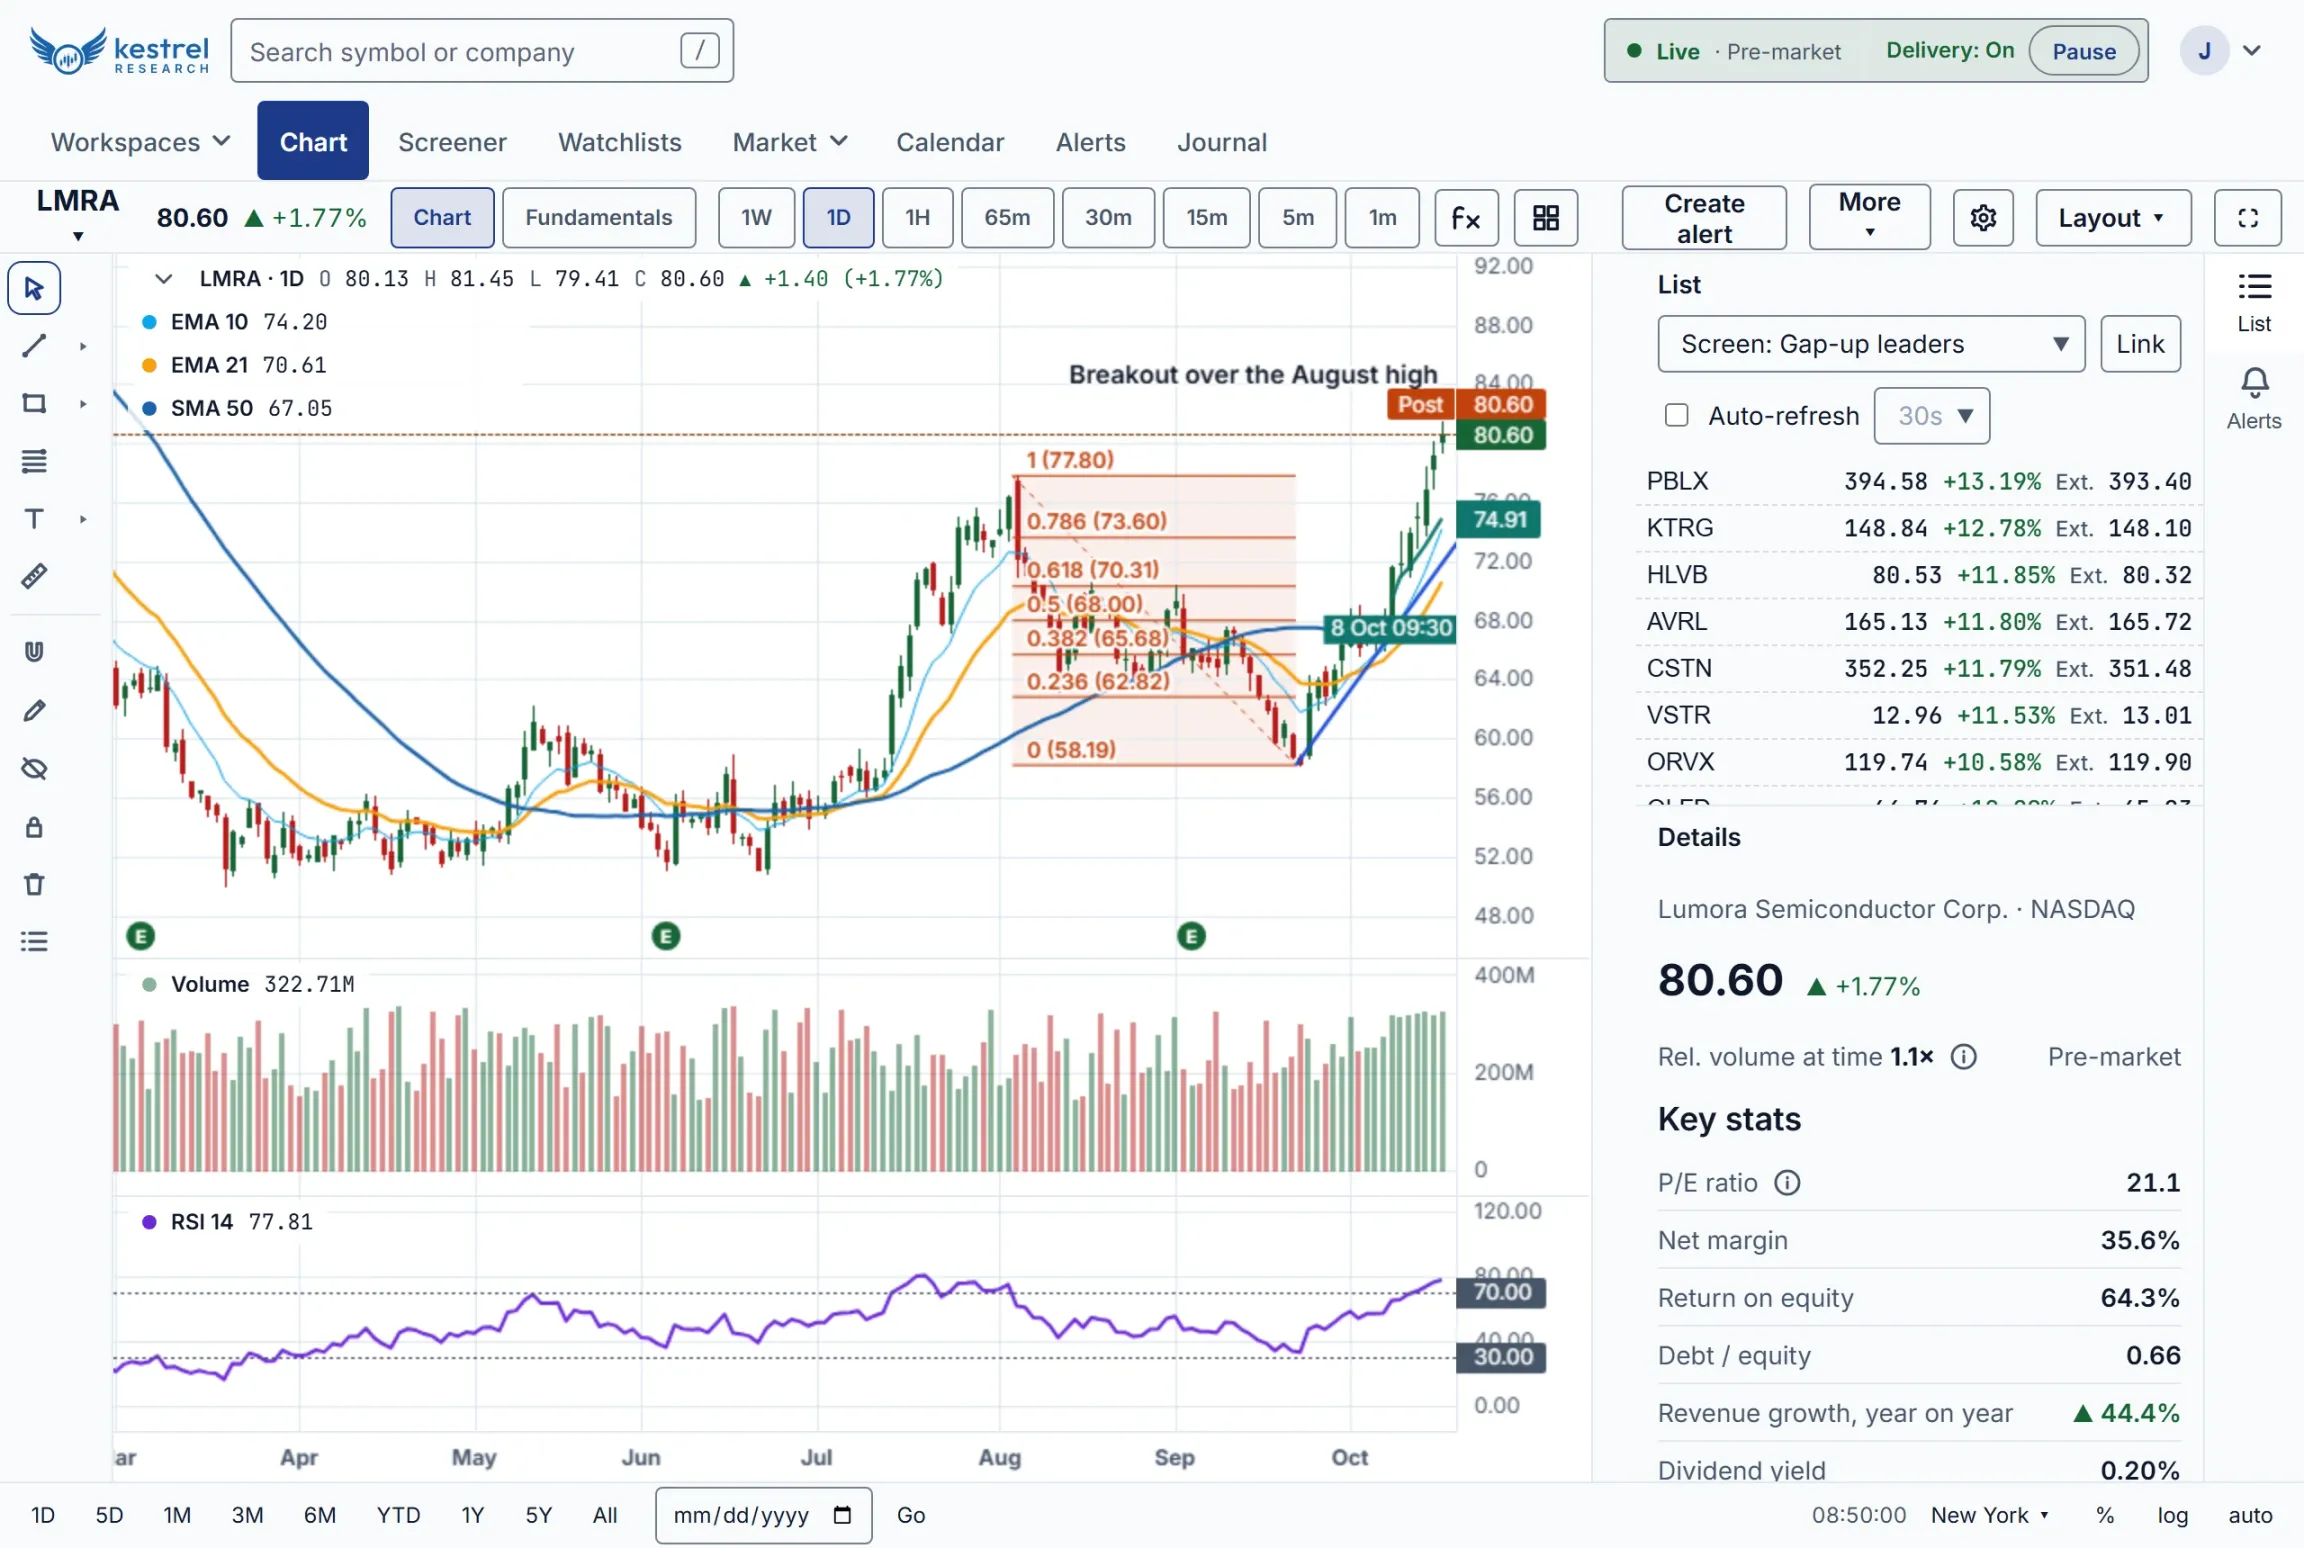
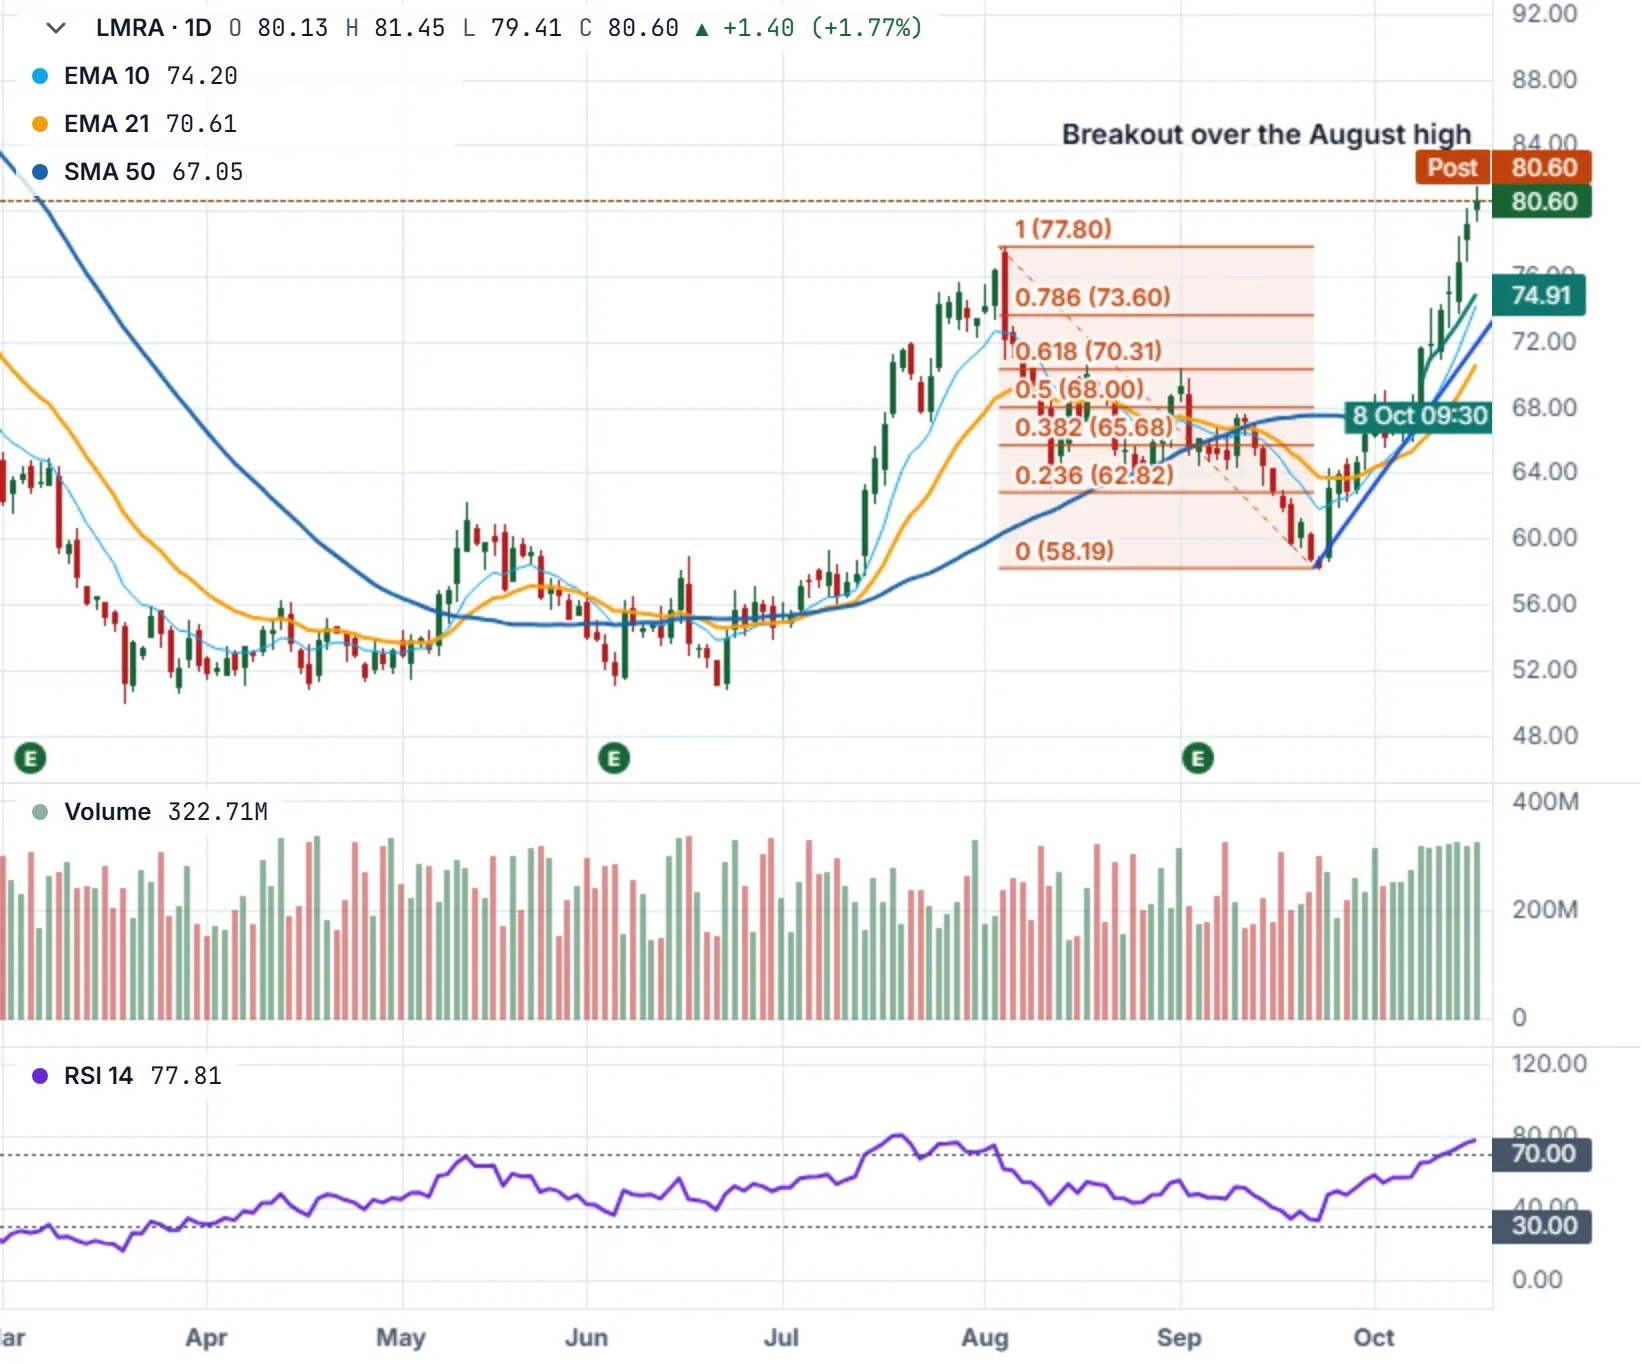
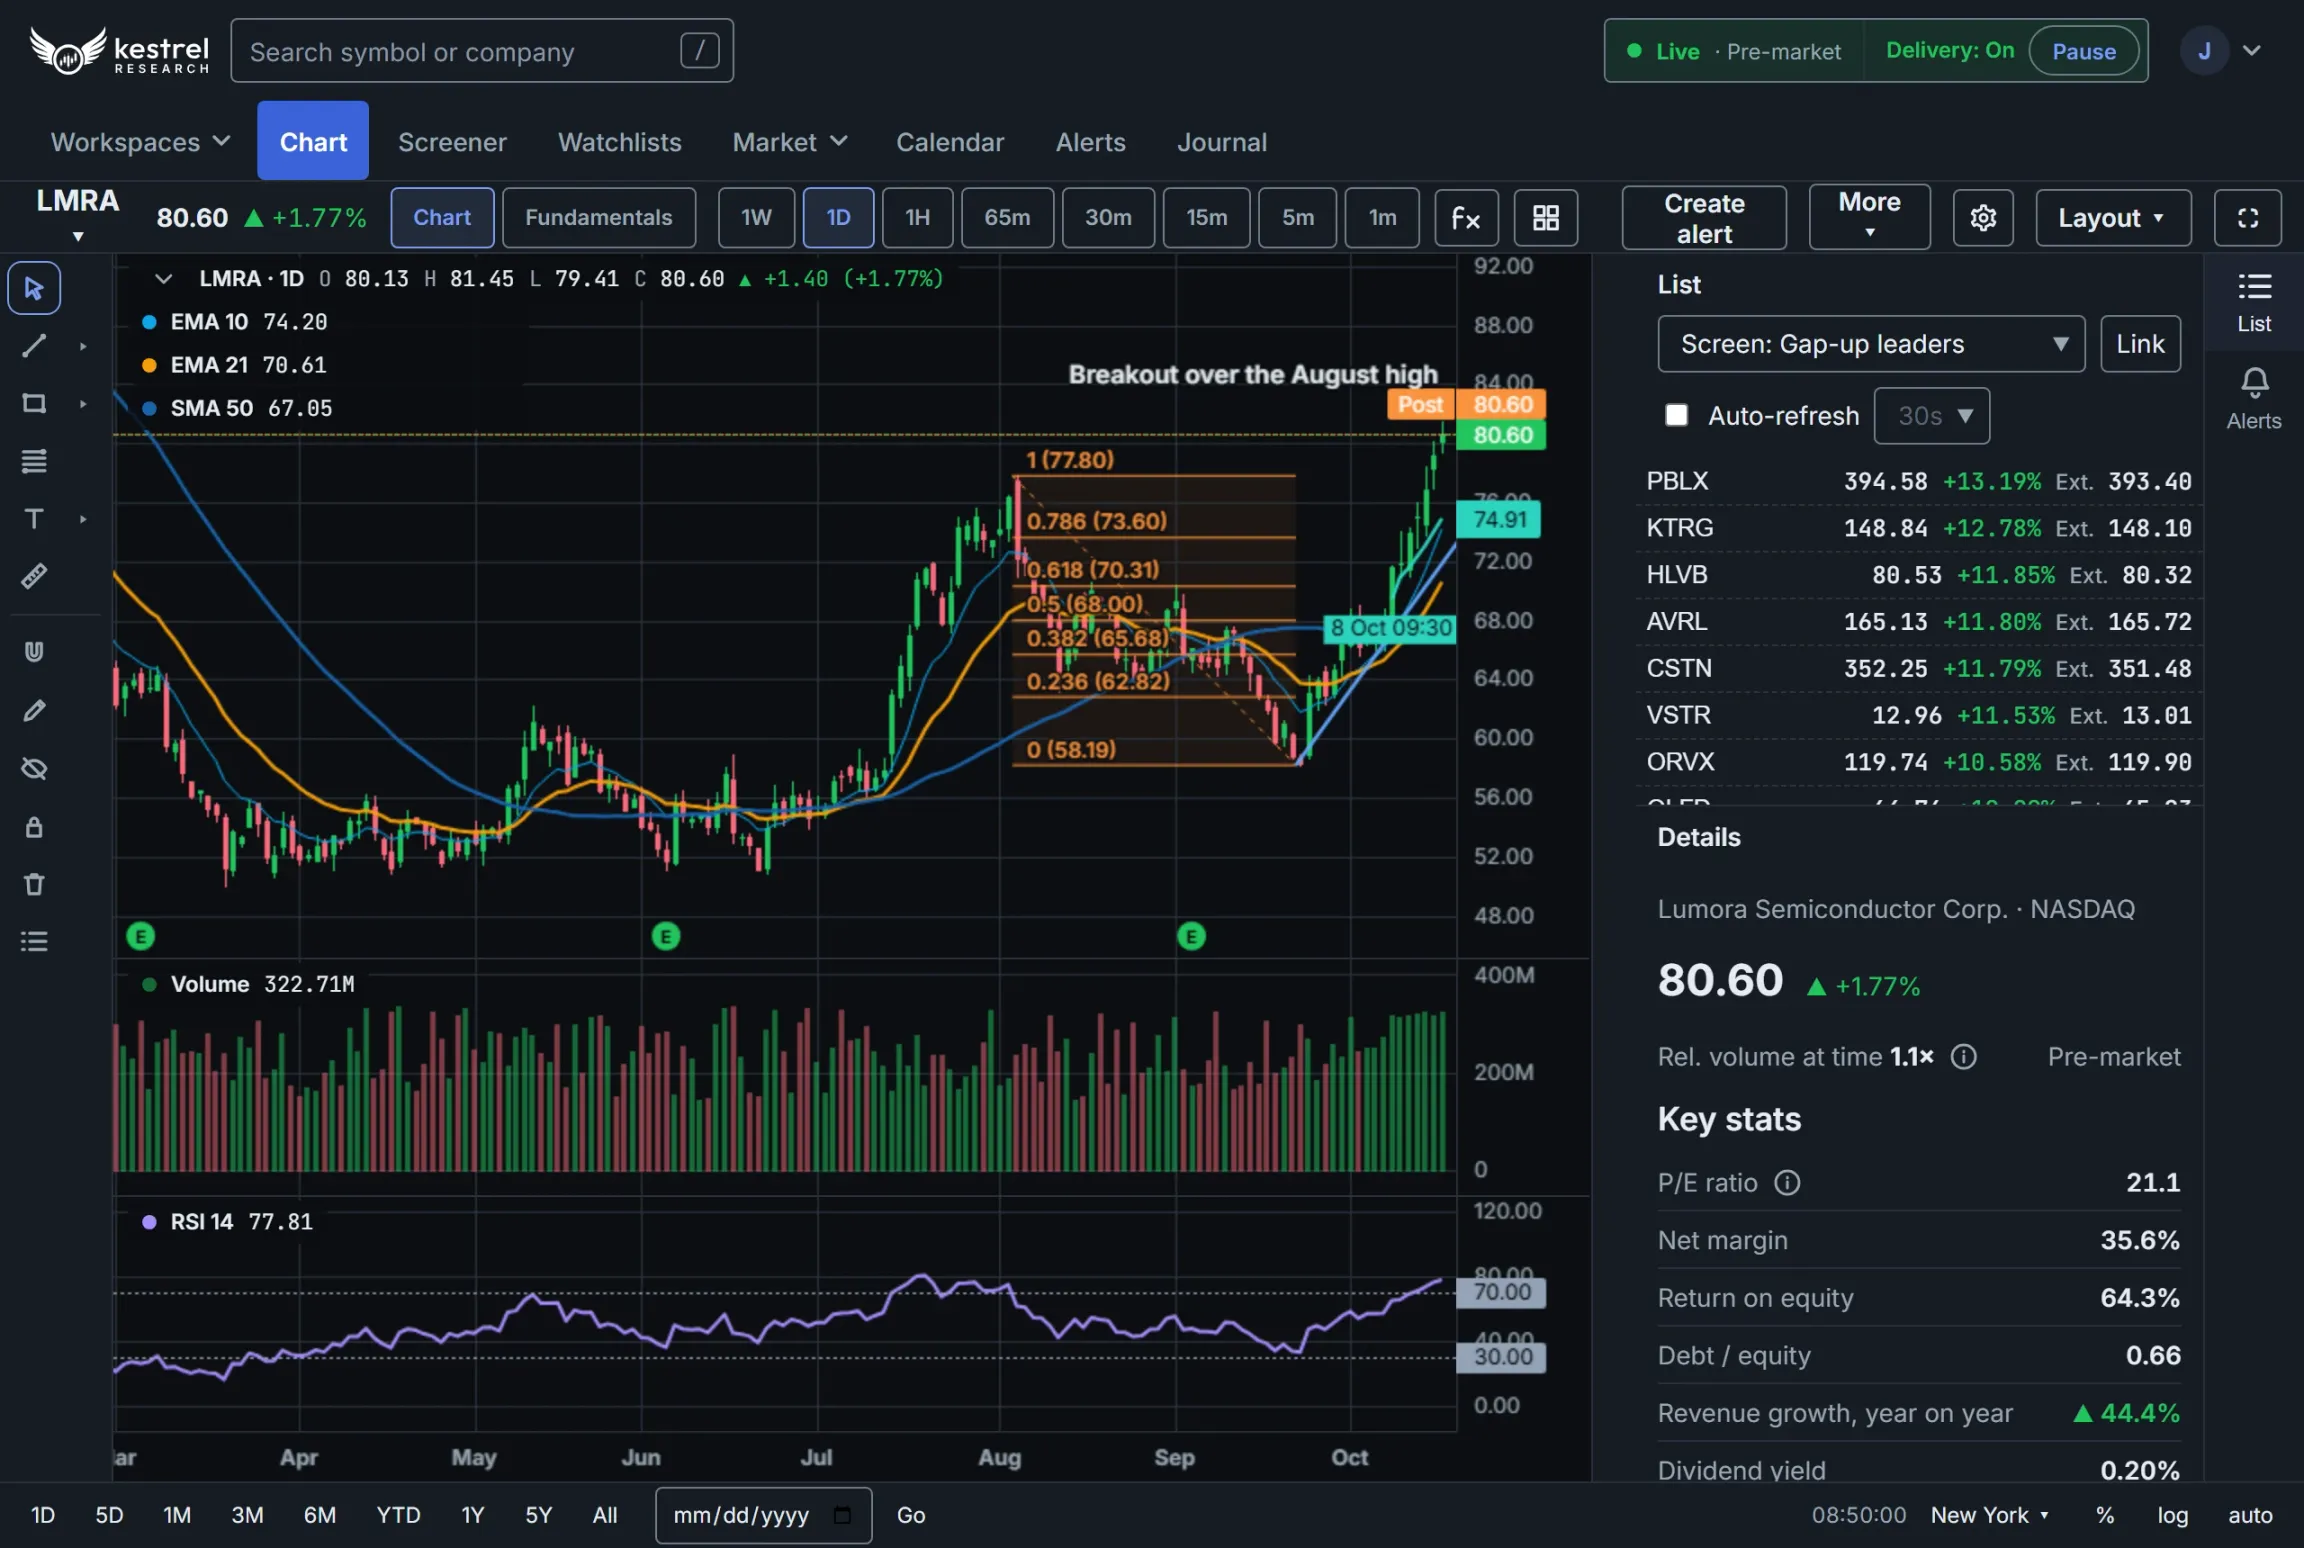
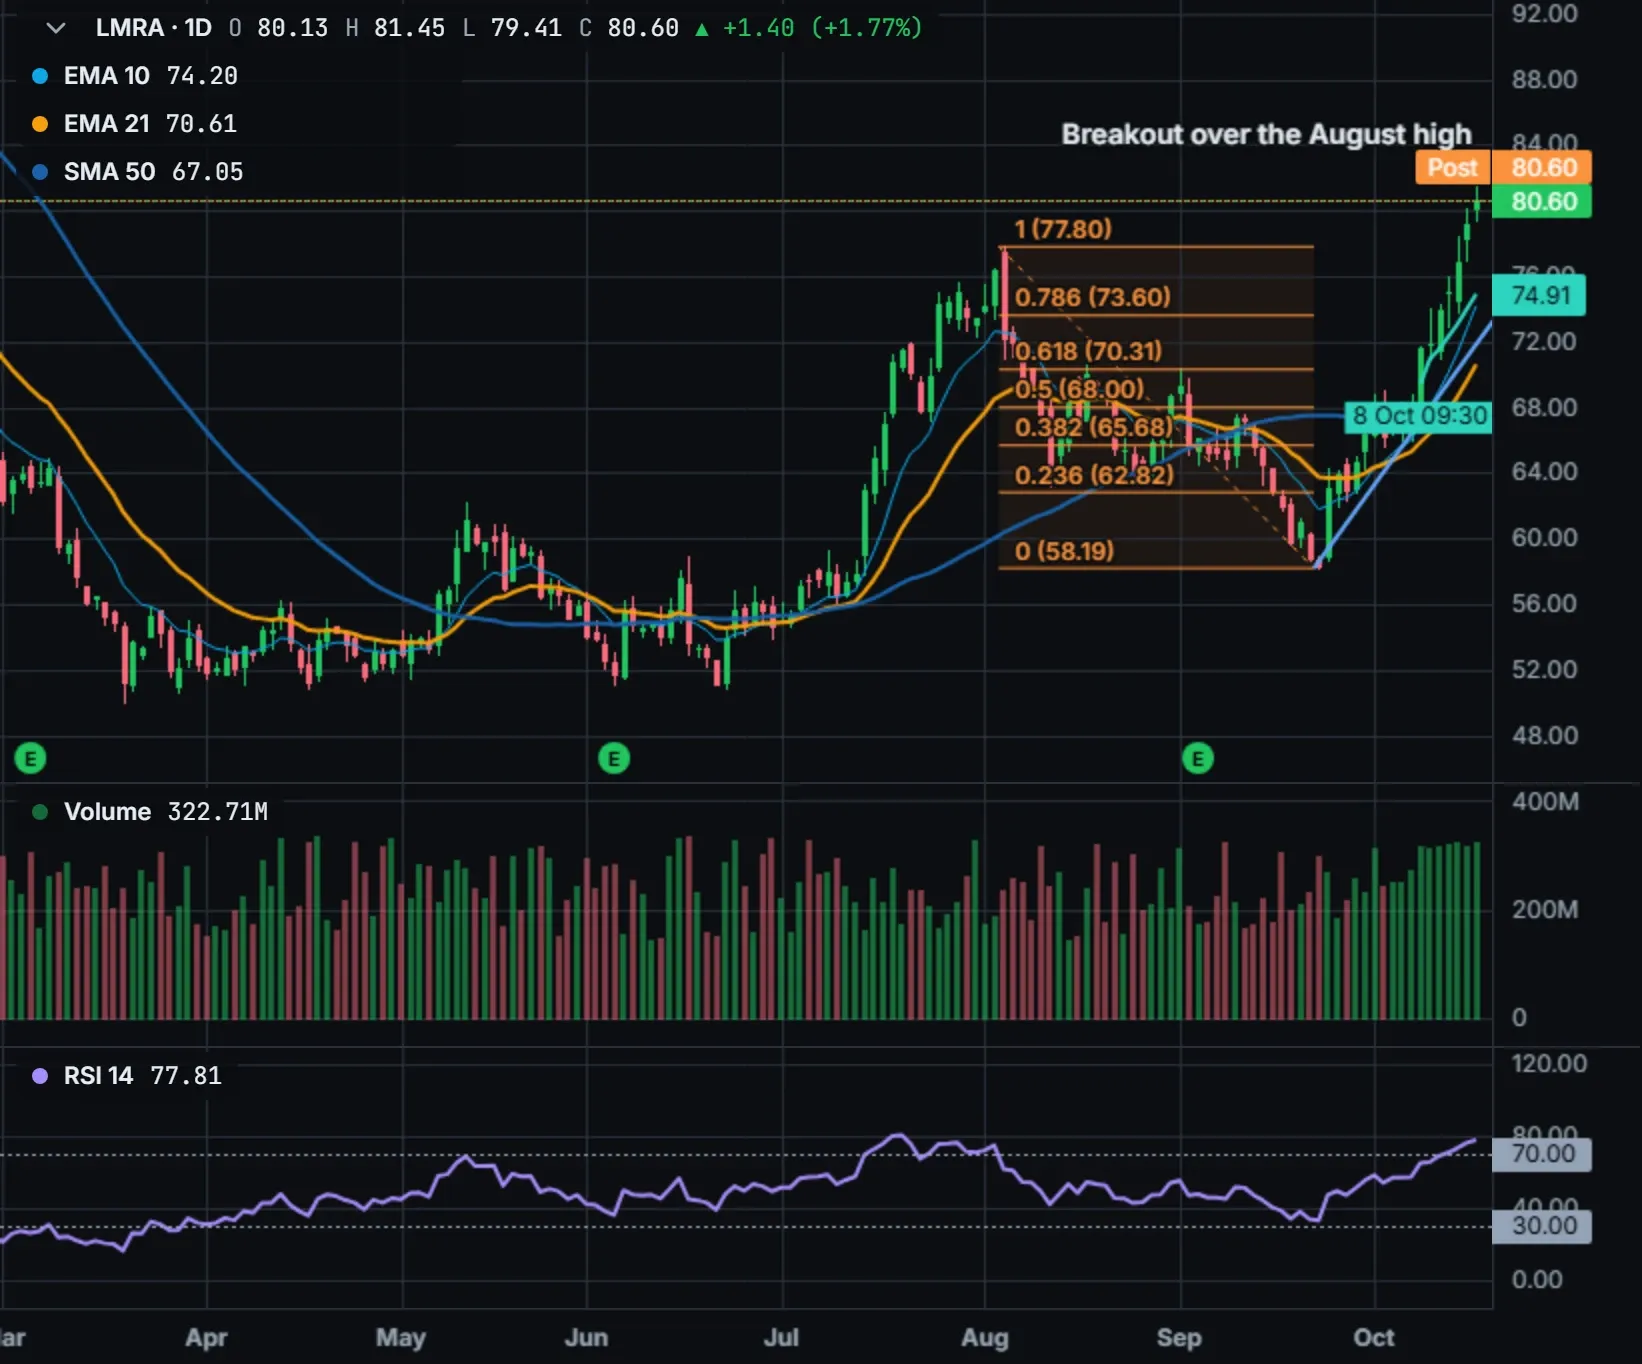
Charts from one minute to weekly, with over 40 indicators, drawing tools including anchored VWAP, and workspaces laid out the way you work.
Timeframes and chart types
- Eight timeframes, from one minute to weekly, including 65-minute and hourly bars.
- Twelve chart types, from candles and bars to Heikin Ashi, each with its own look.
- Extended or regular hours, with the pre-market and after-hours shaded, and a line for the latest out-of-hours price.
- Percent, indexed and logarithmic scales, date-range presets, and go to any date.
Indicators and levels
- Over 40 indicators across moving averages, trend, momentum, volatility, volume and relative strength.
- Each with its own style and inputs, and your own defaults, in the price pane or a pane of its own.
- Calculate an indicator on another indicator's line.
- Key levels: the prior session's high and low, the opening range and the day's high and low, drawn as the day develops.
Drawing tools
- Trend lines, rays, horizontal and vertical lines, rectangles, parallel channels, Fibonacci retracements, text notes and arrows, plus a ruler.
- Anchored VWAP, with or without extended hours, and an alert on it in one click.
- Drawings are saved to your account for each symbol, on every timeframe, intraday only or daily only.
- Lock, clone, hide or list them, and snap them to prices with the magnet.
Templates and layouts
- Save chart templates with their indicators, timeframe and panes, and make your settings the default for every chart.
- Up to four charts on a symbol's page, with a synced crosshair, and link groups that move charts together.
- Workspaces saved to your account: up to six windows across your monitors, built from over 50 widgets, from watchlists and screens to breadth, calendars and fundamentals.
The stock behind the chart
- Key stats beside the chart: valuation, margins, debt, growth, dividend yield and the next earnings date.
- Fundamentals by quarter, by year or for the last twelve months, with the income statement, balance sheet and cash flow.
- Company profile, liquidity and spread, a live quote, earnings reactions, peers and upcoming events.
Screenshots are of the product itself, with made-up companies and prices.